U.S. Elections Project
Nonprofit VOTE and the U.S. Elections Project are excited to release “America Goes to The Polls,” a report that ranks all 50 states in voter turnout for the 2016 election and identifies policies that help contribute to higher turnout.
Highlights:
- National turnout of eligible voters was 60.2% – 1.6 percentage points above the 58.6% turnout in 2012, though slightly lower than 2008. Four in 10 eligible voters did not vote.
- The highest turnout states were Minnesota (74.8%), Maine (72.8%), New Hampshire (72.5%), Colorado (72.1%), Wisconsin (70.5%), and Iowa (69.0%). All six offered same day voter registration, enabling voters to register or update their registration when they vote. Five were battleground states targeted by the campaigns.
- The lowest turnout states were Hawaii (43%), West Virginia (50.8%), Texas (51.6%), Tennessee (52.0%) and Arkansas (53.1%). These five states were at the bottom for the third consecutive presidential election. None were battleground states. All five cut off the ability to register or update a registration three to four weeks before Election Day.
Executive Summary
NATIONAL TURNOUT
Voter turnout exceeded 2012 at a level consistent with the last three presidential elections.
- 60.2% of the nation’s 231 million eligible voters cast ballots, according to ballots counted and certified by state election boards, compared to 58.6% turnout in 2012.
- Four in ten eligible voters didn’t vote. Among the most common reasons voters cite for not voting are a lack of competition and meaningful choices on the ballot or problems with their voter registration or getting to the polls
STATE TURNOUT RANKINGS
The two factors that consistently correlate with higher voter participation are the ability to fix a registration issue when you vote and living in a battleground state.

Same Day Voter Registration
- The six highest-ranking states offered same day voter registration (SDR), which allows voters to register or fix a registration problem when they vote (In order – Minnesota, Maine, New Hampshire, Colorado, Wisconsin and Iowa).
- Voter turnout in states with SDR was seven points higher than states without the option, consistent with every election since the policy was first introduced in the 1970s.
- The significant turnout advantage of SDR states has persisted even as four new states (Colorado, Connecticut, Illinois and Maryland) implemented the policy since the 2012 election.

Automatic Voter Registration (AVR)
- Oregon, the first state to implement AVR, saw the highest turnout increase of any state over 2012 – 4.1 percentage points. AVR pro-actively registers citizens at DMV transactions.
Battleground states
- Five of the six highest-turnout states, and 12 of the top 20, were battleground states.
- The campaigns dedicated 99% of their ad spending and 95% of campaign visits to the 14 battleground states – well over half going to just four states – FL, NC, OH and PA.
- The voices of 65% of the electorate – 147 million voters – were left on the sidelines from determining the presidency – living in the 36 non-battlegrounds states whose electoral votes were pre-ordained. That, in fact, is largely what happened.
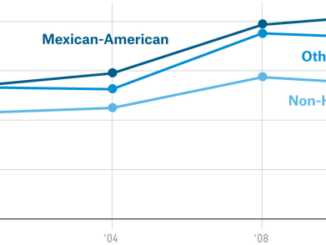
- Latino (75%) and Asian American voters (81%) lived disproportionately outside swing states and, as a result, experienced 10-16% less voter contact than their swing state counterparts and a reduced voice in the election of the president.

Lowest ranking states
- Hawaii, West Virginia, Texas, Tennessee, and Arkansas were at the bottom five for the third consecutive presidential election. None were battleground states. All five cut off the ability to register or update a registration three to four weeks before Election Day.
- National turnout was reduced by a full 1.5 percentage points due to low turnout in three of the four most populous states – California, New York and Texas.
RECORD LOW COMPETITION IN U.S. HOUSE RACES
The lack of competition in Congressional races compounds the lack of competition in non-battleground states in the presidential race.
- Competition in House elections reached its lowest level since Cook Political Report began rating competition in 1984. Cook rated 37 of the 435 U.S. House races as competitive on the eve of the 2016 election.
- In the end, even fewer House seats – 33 – ended up being competitive with a margin of victory between the top two candidates of 10% or less. 73% of House races were won by landslide margins of victory – over 20%.
Download Full report as PDF
America Goes to The Polls 2016, a report that ranks all 50 states by Latinos Ready To Vote