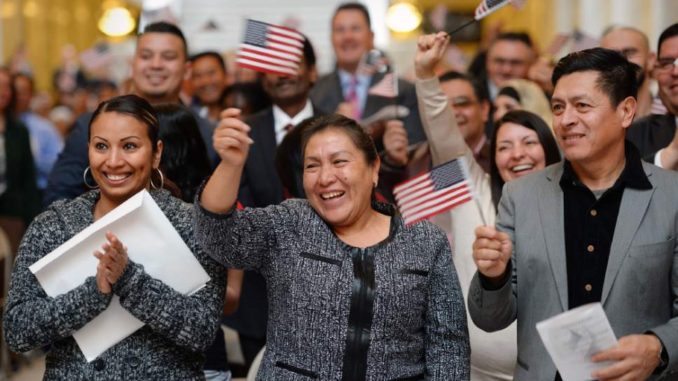
Donald Trump’s anti-immigrant rhetoric is by now well known, from his recent attack on Judge Gonzalo Curiel’s impartiality to his comments that Mexican immigrants are overwhelmingly criminals and rapists. The Washington Post reports that there’s been a substantial uptick in citizenship applications in the first quarter of 2016, writing:
Many would-be applicants have told activists that they are primarily motivated to become citizens because of Trump, who has proposed deporting 11 million undocumented immigrants and building a wall on the U.S.-Mexico border.
Do naturalized citizens favor one party over the other? Have U.S. immigrants’ political orientations changed over time? How important is the immigrant vote in national elections? In my new book Altered States, I’ve examined these and several related issues, which I discuss below.
Immigrant voters have changed over the past 50 years
As you’d imagine, naturalized citizens today are politically quite different from those the United States has seen in the past. As recently as the 1970s, naturalized citizens used to “look” a lot like the native-born population; they were roughly the same race, ethnicity, party and ideology.
But by the 2000s, the foreign-born citizen population had become overwhelmingly non-white, mostly of Latin American and Asian and Pacific Islander descent. And substantially more of today’s immigrant voters are Democratic and liberal than we see among the native-born population.
The figure below looks at the relationship between the percentage of states’ voting-age population who were foreign-born U.S. citizens and how much change there was over time in the percentage of votes cast in the states for the Democratic presidential candidate.
They’ve become more Democratic
What we’re trying to see is this: Did Democrats see larger gains over time in vote share in states with relatively large numbers of foreign-born voters than they did in states with fewer foreign-born voters? And if so, how large were those changes?
On the vertical axis we’re measuring the change between the average state outcomes (Democratic percent of the state two-party vote) from 1972-1980 to 2004-2012. (For the technical details about why I used this method, see my post here.) On the horizontal axis we’re looking at the percent of the state’s citizen voting-age population (CVAP) in 2008 who were foreign born.
Here we can see that the more foreign born voters a state has, the greater the increase in the percentage of people who voted Democratic. Where there aren’t very many foreign-born voters, the Democrats gained in some states and Republicans gained in others. But Democrats got more votes in virtually every state that had an above-average level of foreign-born voters.
The only exceptions to this are Alaska and Texas. Otherwise, the entire lower right corner of the graph — high foreign-born population, coupled with Democratic losses — is empty.
All of the states with the highest proportions of foreign-born voters (California, Florida, Hawaii, Illinois, Nevada, Massachusetts, New Jersey, and New York) are states where Democrats made some of their greatest gains. Many of these states — including California, Illinois, and New Jersey — used to be fairly competitive but are now clearly in the Democratic camp. Others – such as Florida and Nevada — once leaned Republican but are now fairly competitive.
We can look at this another way, too. In the set of graphs below, each dot represents a state’s foreign-born citizen voting-age population (horizontal axis) and that state’s percent of the two-party vote won by the Democratic candidate (vertical axis). As we can see, in the 1970s and 1980s, there was little to no relationship between the relative size of foreign-born voting population and the proportion of the state’s votes that went to the Democratic presidential nominee. (The big exception is 1972.) That has changed over time, as you can see by the increasing tilt in the line that summarizes the overall relationship between the size of the foreign-born population and the percent of the two-party vote won by Democratic presidential candidates in the states in each year. From the 1990s forward, when a state has a higher percentage of foreign-born voters, the Democratic presidential nominee tends to get a higher percentage of that state’s vote.

To get technical for a moment, the average election-year correlation between foreign-born voters and Democratic votes cast was .18 from 1972 to 1980, .29 from 1984 to 1992, .50 from 1996 to 2000, and .56 from 2004 to 2012. Overall, the strongest correlation was .60, in 2012.
So the immigrant vote is getting larger, and and it’s also trending Democratic. How much will that affect elections?
That depends in part on where those foreign-born voters live. They’ll be more pivotal in swing states than they will in states that are already solidly Democratic or Republican.
Of these states, only New Mexico’s proportion of foreign-born voters grew slowly between 2000 and 2012, so it won’t likely see a big effect from this shift. But three swing states — Florida, Nevada, and Virginia — are among those whose proportion of foreign-born voters grew most rapidly during that time. If the 2016 election is close, the growth in the immigrant vote could tilt these states toward the Democratic nominee. And that could be key in the Electoral College.
U.S. foreign-born voters aren’t only Latino. But that won’t help the Republicans.
Finally, while many of Donald Trump’s more notorious statements about immigration have focused on Mexican and Latin-American immigrants, the United States’ naturalized voters include just about as many immigrants from Asia (37 percent) as from Latin America (39 percent).
But that’s not good news for the Republicans. Like their Latin-American counterparts, Asian-Americans also hold overwhelmingly negative views toward Donald Trump and the Republican Party, and actually supported President Obama at slightly higher rates than Latinos did in 2012.
Thomas M. Holbrook is the Wilder Crane Professor of Government at University of Wisconsin-Milwaukee. Follow his posts at Politics by the Numbers.


