by Committee for a Responsible Federal Budget
When it comes to fiscal policy, it is increasingly clear that children are not a high priority. Recent tax cuts and spending increases have burdened younger and future generations with massive new debt, on top of an already unsustainable fiscal situation. Meanwhile, children receive only a small and declining share of the budgetary resources at the federal level.
As part of our Budgeting for the Next Generation series, this paper shows how children fare in the current budget and how that has changed and will change over time. Specifically, we show:
-
Less than one-tenth of federal spending and support – a term we use to include both outlays and tax provisions – went to children in 2016. The majority of those resources were in the form of health spending or tax breaks.
-
Spending and total support for children grew significantly between 1960 and 2010 in dollars, percent of GDP, and share of the budget.
-
Federal support for children has fallen since 2010 and is slated to continue falling.
-
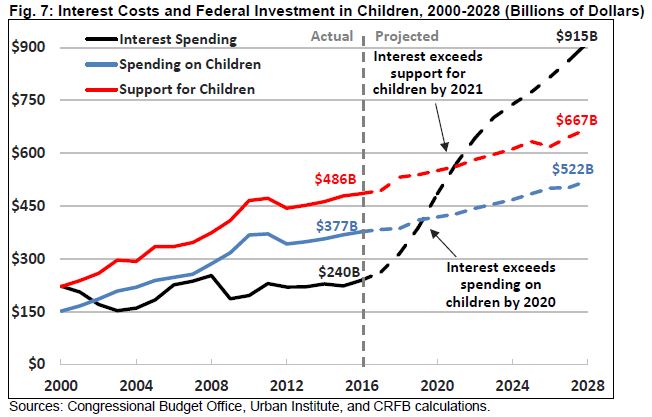
Interest costs will exceed spending on children by 2020 and support for children by 2021. In other words, the federal government will soon spend more on debts incurred in the past than on investment in the future.
This paper builds on our previous piece, Budgeting for the Next Generation: A New Series on Children and the Federal Budget, and will be followed by future papers showing how the budget process disadvantages children’s programs and what possible solutions exist to ensure the United States is investing in, rather than borrowing from, our future.
We rely heavily on data generated by the Kids’ Share project at the Urban Institute, which releases an excellent and comprehensive report on children and the budget every year.
Their research and ours makes clear that policymakers are burdening our children with massive amounts of debt, while doing little to invest in their future. This unfortunate combination threatens the long-standing practice in this country that each generation leaves a better world for the generation that follows.
Children Get a Small Share of Federal Resources
The federal government spent nearly $3.9 trillion in fiscal year 2016; only $377 billion, or about 9.8 percent of the federal budget, went to children. These estimates, which come from the Urban Institute’s 2017 Kids’ Share report, include both direct spending on children and spending that accrues to parents.
Even using this broad measure, combined spending on children in 2016 was only about two-thirds as large as spending on defense ($585 billion) or Medicare ($588 billion) and only two-fifths of total spending on Social Security ($910 billion).1
According to Kids’ Share, the rest of the budget was spent on: Medicare, Medicaid, and Social Security for adults (46 percent); defense (15 percent); other non-defense priorities (23 percent); and interest payments on the debt (6 percent).
Thought of another way, while less than one-tenth of spending went toward children, over one-third went to the elderly. In part as a result, children face poverty rates nearly twice as high as the elderly (18.0 percent versus 9.3 percent).
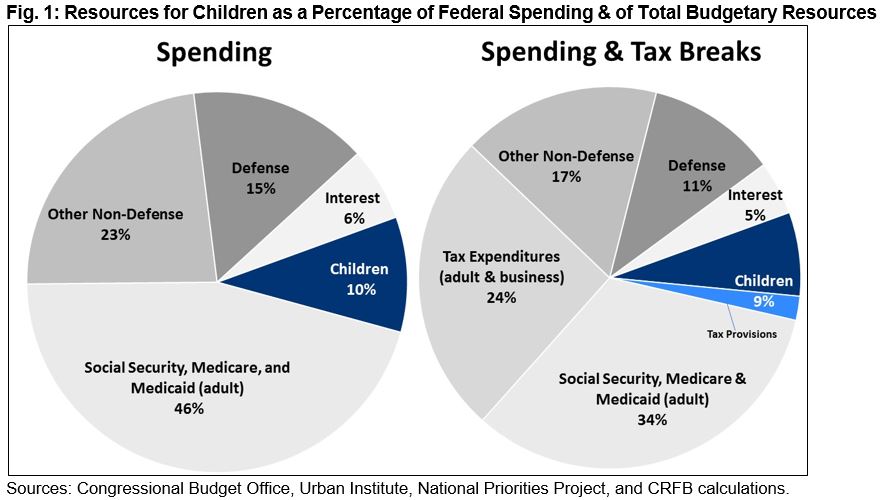
Another way to measure what the federal government puts toward children is to measure the combined effect of spending and tax provisions, a measure we call “budgetary support.” In 2016, the federal government lost about $108 billion of revenue as a result of tax breaks and provisions for children (and their parents), resulting in total budgetary support of $486 billion. This represents 9.4 percent of the $5.2 trillion in combined federal spending and tax provisions.2
Of the $486 billion of budgetary support for children, $132 billion, or just over one-quarter, went towards health care. That includes $89 billion in Medicaid spending, $14 billion in spending on the Children’s Health Insurance Program (CHIP), $22 billion in tax benefits from the employer-sponsored health insurance exclusion and premium tax credits, and $7 billion in other spending.
Tax provisions for having children made up another fifth ($91 billion) of the budgetary support for children. This includes $41 billion for the $4,050 per child dependent tax exemption (which was recently repealed for 2018-2025) and $50 billion for the Child Tax Credit of $1,000 per child (which was recently doubled for 2018-2025).
Nutrition, income security, the Earned Income Tax Credit, and education and training for parents each cost nearly $60 billion and each make up roughly one-tenth of the federal support for children in 2016.

Social services and housing programs each consume less than 3 percent of federal support for children and less than 0.3 percent of total spending and tax breaks.
Federal Support for Children Grew Between 1960 and 2010
During the half-century prior to 2010, federal spending and tax breaks for children grew substantially.
Kids’ Share estimates that real (inflation-adjusted) spending grew from $19 billion and 0.6 percent of GDP in 1960 to $405.1 billion and 2.5 percent of GDP in 2010. Total federal budgetary support for children, meanwhile, rose from $61 billion or 1.8 percent of GDP in 1960 to $513 billion or 3.1 percent of GDP in 2010.
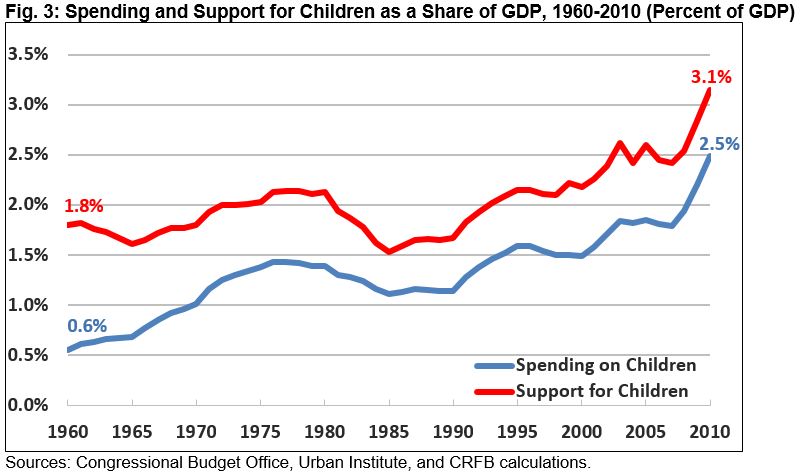
As a share of the budget, spending grew from just over 3 percent of outlays in 1960 to nearly 7 percent in 1975 and nearly 11 percent in 2010. Total support for children rose from less than 8 percent of spending and tax provisions in 1975 to more than 10 percent in 2010 (prior data is not easily available).
Legislative expansions drove most of this increase. The establishment of Medicaid in 1965 (with major expansions in 1967, 1972, 1986, 1989, 1990, and 2010) provided health coverage to millions of children. Also in 1965, Congress passed the Elementary and Secondary Education Act (major expansions in 1969, 1972, 1984, and 2001), establishing a federal role in funding public education.
The food stamp program (now called SNAP) was created in 1964 (with major expansions in 1973, 1974, 1977, 1988, 1993, 2002, 2008, and 2009) followed by the enhancements to the federal school lunch program through the Child Nutrition Act of 1966. Legislation in the 1970s introduced Supplemental Security Income, Section 8 low-income housing, and the Earned Income Tax Credit (EITC), which remain major sources of support for children.
Thanks to these programs, federal support for children hit its first peak as a share of the economy in the late 1970s, at 2.1 percent of GDP. It then fell to 1.5 percent of GDP in the mid-1980s, largely because the value of the dependent tax exemption declined but also because federal outlays devoted to children were reduced over the decade.

During the 1990s, however, spending on children rebounded. In-kind benefits providing education, health, and nutrition rose in importance, accounting for roughly half of all expenditures on children by the mid-1990s. Health spending on children, in particular, reached a new high as a percent of GDP in 1995, and other mandatory spending increased.
The 1997 budget agreement ushered in two key programs for children – the Children’s Health Insurance Program (CHIP) and the Child Tax Credit. CHIP was extended and/or expanded in 2007, 2009, 2014, and 2018, while the child tax credit was extended and/or expanded in 2001, 2009, 2010, 2013, 2015, and 2017.
Providing a final surge in children’s spending was the 2009 American Recovery and Reinvestment Act (ARRA), an economic stimulus bill that temporarily increased spending and expanded tax breaks. About one-fourth of that legislation went to children through spending and tax breaks for education, health care, SNAP, the EITC, and the Child Tax Credit.
Due to the ARRA and to “automatic stabilizers” in response to the Great Recession, total federal support for children grew substantially in 2010. Support for children grew from $421 billion (real dollars) and 2.5 percent of GDP in 2008 to $513 billion and 3.1 percent of GDP by 2010.
Federal Support for Children Has Fallen Since 2010 and Continues to Decline
Federal support for children peaked in 2010 and has been on a downward trend ever since; recent legislation will only temporarily halt this trend. In real dollars, total support for children declined from $513 billion in 2010 to $486 billion in 2016, while spending fell from $405 billion to $377 billion. The effect is more significant as a share of the economy, where total support has fallen from 3.1 percent of GDP to 2.6 percent and spending from 2.5 percent of GDP to 2.1 percent.
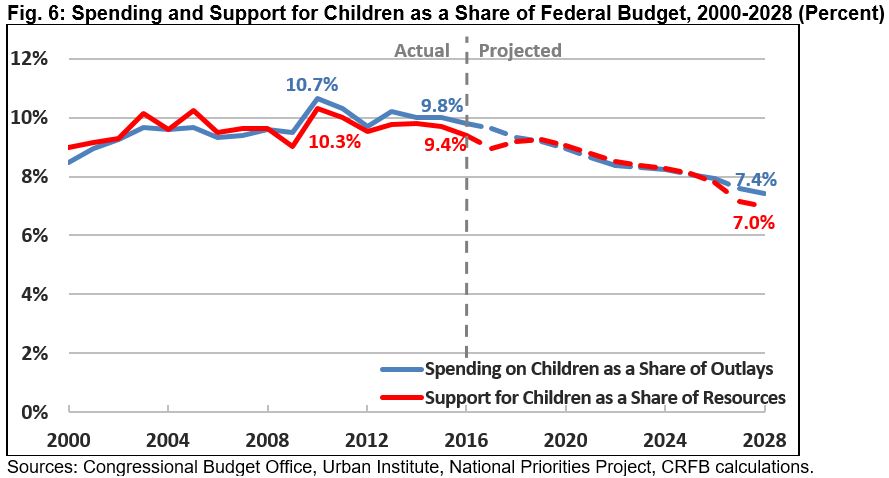
Relative to the size of the budget, spending on kids fell from 10.7 percent of spending in 2010 to 9.8 percent in 2016; total support for children fell from 10.3 percent of support in 2010 to 9.4 percent by 2016.

A number of factors are responsible for this decline. In part, the peak in 2010 was the result of a one-time spike from the Great Recession and ARRA that was never expected to last and has since receded. At the same time, the 2011 Budget Control Act imposed caps on discretionary spending and a subsequent “sequester” reduced those caps further because of failure to reach a debt deal.
More fundamentally, the retirement of the Baby Boom population and rise of health care costs means that a larger share of federal spending is going toward the elderly. Meanwhile, policymakers have opted to cut taxes rather than finance this spending with more revenue.
With finite dollars, rising and underfinanced spending on the elderly will almost inevitably lead to lower spending on children. This reality is reflected in future budget projections, even after accounting for recent spending increases and even despite rising deficits.
Using a methodology similar to Kids’ Share, we project spending on children will fall from 2.1 percent of GDP in 2016 to 1.9 percent in 2019 (despite the recent spending hike deal) and 1.75 percent of GDP by 2028. (Spending will rise slowly in real dollars, from $377 billion in 2016 to $412 billion in 2028.)
We estimate that total support will fall from above 2.6 percent of GDP in 2016 to 2.4 percent in 2025 and 2.2 percent of GDP by 2028, after the individual provisions of the 2017 tax law expire. Support will rise slowly in real dollars, from $486 billion to $527 billion.
This decline is even more stark when compared to the overall budget. By our estimates, spending on children will decline from 9.8 percent of the budget in 2016 to 9.2 percent in 2019 and 7.4 percent in 2028. Total support for children will fall from 9.4 percent of comparable resources in 2016 to 9.3 percent in 2019, 8.1 percent in 2025, and 7.0 percent in 2028.
Over the long term, as the costs of Social Security, Medicare, and interest on the debt rise, this trend will worsen.
The Federal Government Will Soon Spend More on the Past Than on the Future
As debt rises over the next decade, the federal government will spend more money servicing past spending through interest on the debt rather than making investments in future generations.
Interest is currently the fastest growing part of the budget. Under current law, interest costs will exceed spending on children by 2020 and total federal support for children by 2021. Based on current trends, the United States could end up spending twice as much servicing its debt as it does on children by roughly 2030.
Replacing spending on children with spending on interest is economically and generationally backwards. Economically, rising interest payments provide no benefit while declining investment in children will ultimately mean lower productive capacity and slower economic growth. Generationally, it is unfair to burden younger Americans with the costs of tax cuts and spending enjoyed by prior generations, while leaving them fewer tools and skills to pay these costs.
The combination of rising interest spending and falling children’s spending isn’t just an unfortunate coincidence. As we will explain in a future paper, the current budget process favors adults and seniors over children: programs for children require more regular review and re-authorization, lack dedicated funding sources, and rarely have the same built-in and automatic growth as programs for the elderly. As spending on interest rises, therefore, it is much more likely to crowd out spending on children than spending in other areas.
Conclusion
While federal support for children grew substantially from 1960 through 2010, it has since declined and is on course to decline further. While recent tax and spending laws will offer a small temporary boost to children, they will not fundamentally reverse this trend. To make matters worse, this legislation will add to the already massive debt burden the country is passing on to future generations.
As spending on the elderly and interest rise and revenue fails to keep up, children are likely to receive an ever-declining share of federal resources despite the economic and distributional advantages of investing in children. Absent real budget process changes, substantial reduction in debt, and/or a serious reprioritization of existing budgetary commitments, investment in future generations will continue to erode.
1 To maintain consistency between the numerator and denominator, our measure of tax provisions includes the added (but not interacted) value of all income tax expenditures as well as the fiscal impact of the dependent exemption for children. Different measures of tax provisions would yield different results.
2 Note that these numbers are not strictly comparable since some Social Security spending goes to children and is thus counted in both figures.