Many politicians—including President Donald Trump—suggest that the nation is being overwhelmed by less skilled immigrants from Mexico and the rest of Latin America, necessitating the government building a wall across the southern border. However, the U.S. Census Bureau’s American Community Survey numbers make plain that immigration from Latin America is slowing, as recent arrivals are coming from countries in Asia and are more prone than native-born Americans to obtain a college education. Moreover, these “21st century immigrants” are locating in parts of the country where immigrant concentration has been low, and in many states that supported Trump in the 2016 election.
Newly released census data for 2017 show that the foreign-born percentage of the U.S. population reached a 107-year high of 13.7 percent in 2016. This new release continues to point out that immigrants who arrived since 2010 portray a far different image than is commonplace in political discussions.
Figure 1 presents a historical picture of changes in the share of the nation’s foreign-born population since the beginning of the 20th century. Over this period, the foreign-born percentage peaked at 14.7 percent in 1910: the result of large waves of immigrants arriving from European countries including Italy, Poland and Germany. This surge subsequently tapered off, especially after restrictive immigration legislation was implemented in the 1920s, along with the migration-inhibiting effects of the Great Depression and World War II.

As restrictive immigration continued, the foreign-born share plummeted to just 4.7 percent in 1970—the same year when the size of the immigrant population reached a 20th century low of 9.6 million. The Immigration and Naturalization Act of 1965 opened up immigration and lifted restrictive national quotas, which led to larger numbers of immigrants from all parts of the world but particularly from Latin America. Large foreign-born gains occurred particularly during the 1990s when the share rose from 7.9 to 11.1 percent. That share rose to 13.7 percent in 2017, and should continue to increase in light of the more modest growth of the aging native-born population. (From 2010 to 2017 the immigrant population grew by 11.4 percent, compared with only 4.4 percent for native-born population.) Although gains have been somewhat more modest in recent years, the 2017 foreign-born population stood at 44.5 million, more than double the size in 1990 and greater than four times the low point in 1970.
21st century immigrants are more educated, less likely to come from Latin America
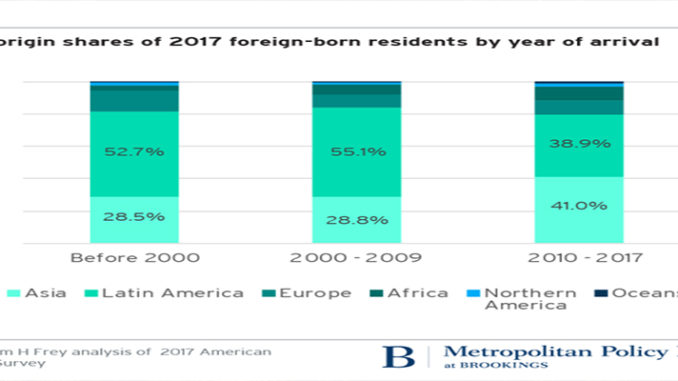
Though the nation’s foreign-born share continues to rise, recent immigration looks different now than that which characterized much of the late 20th century. An important change is with immigrants’ country of origin. As Figure 2 shows, Asia now exceeds Latin America as the major origin region for foreign-born residents that have arrived since 2010. Forty one percent of those who have arrived since 2010 were born in Asia compared with 38.9 percent from Latin America. This differs sharply from arrivals from 2000 to 2009, or before 2000 when well over half of immigrants were born in Latin America and less than 30 percent were born in Asia.

In fact, from 2000 to 2017, the top three countries where immigrants migrated from were China, India, and the Philippines (download Table 1). Mexico—a long term leader in U.S. immigrant gains and still the greatest country of origin of all U.S. foreign-born residents—had its number of immigrants diminished by 440,000 between 2010 and 2017. Overall, Latin America still represents the largest share of all U.S. foreign-born residents at 50.4 percent. However, recent immigration favors Asians, including refugees with Asian origins. Between 2016 and 2017, Asian foreign-born gains were more than triple those for Latin Americans, 446,000 compared to 130,000. While some of the earlier slowdown in Latin American immigration could be linked to the aftermath of the 2007 to 2009 recession and the subsequent lack of demand for workers from neighboring countries, the recent numbers suggest this pattern is continuing even as the U.S. economy revives.
Another distinction associated with post-2010 immigration is the greater preponderance of college graduates. As shown in Figure 3, college graduates—including those with bachelors as well as more advanced degrees—comprised 45 percent of 2010-2017 foreign-born arrivals in contrast to 30 percent or less for arrivals in previous decades. Already apparent at mid-decade, this is partially related to greater numbers of migrants from Asia—though there is wide variation in education attainment among Asian and Latin America countries of origin. It is also a consequence of shifting economic pulls in the U.S., new attractions for students, and industry demands for both permanent and temporary workers.

Immigrants are dispersing into states with smaller foreign-born populations
This new 21st century immigration trend is occurring in large parts of the country and particularly in states that historically had a small foreign-born presence. The map below distinguishes between high, medium, and low concentrations of immigrants. The classic immigrant magnet states, mostly on the coasts and selected parts of the interior, have a high foreign-born concentration. Many of the “middle of the country states” have a moderate immigrant presence, and a low foreign-born population can be seen in places such as Appalachia, the Deep South, and parts of the Great Plains.

The accompanying table (download Table 2) presents attributes for the states in each group and shows that the fastest growing foreign-born populations over the 2010-2017 period are more prevalent in states with the lowest shares of immigrants. For example, North Dakota, where the immigrant population represents just 4.1 percent of all residents, increased the size of that population by 87 percent since 2010. Low immigrant concentration states such as West Virginia and South Dakota increased their foreign-born populations by a third; Kentucky and Tennessee showed growth by over one fifth. Among the 15 low foreign-born concentration states shown on the map, eight exhibited foreign-born growth rates higher than the nation. And of the 21 moderate foreign-born concentration states, 16 showed higher than national rates of foreign-born growth.
More importantly, most of the states in these two categories exhibit 21st century migration patterns. The vast majority of moderate and low foreign-born concentration states are receiving most of their recent immigrant gains from Asian countries, more so than for pre-2010 arrivals. And, as a result of more recent more college graduate-selective immigration, many now show more educated foreign-born than native-born populations (selected states are shown in Figures 4 and 5).


Political messages diverge from facts
The current messaging regarding immigration by some politicians—including President Trump—diverges from the facts. That is, assertions that Latin American origin immigrants are overwhelming the country and largely low skilled migrants are draining public resources may have been relevant for some parts of the country in the 1990s. But recent immigration waves do not conform at all with this picture. This is especially the case for states with moderate and low foreign-born concentrations, most of which voted for Trump in 2016 (download Table 2). Other research has shown that metropolitan areas located in these states are increasingly dependent on immigration as a means of stemming population decline and, by extension, contributing to their human capital. The current shifts in immigrant countries of origin, attributes, and residential destinations suggest that a different narrative about immigration, based on the facts, needs to be emphasized—one that is consistent with emerging 21st century immigration.


