by and
Number from Mexico continues to decline, while Central America is the only growing region
 The number of unauthorized immigrants in the U.S. fell to its lowest level in more than a decade, according to new Pew Research Center estimates based on 2016 government data. The decline is due almost entirely to a sharp decrease in the number of Mexicans entering the country without authorization.
But the Mexican border remains a pathway for entry by growing numbers of unauthorized immigrants from El Salvador, Guatemala and Honduras. Because of them, Central America was the only birth region accounting for more U.S. unauthorized immigrants in 2016 than in 2007.
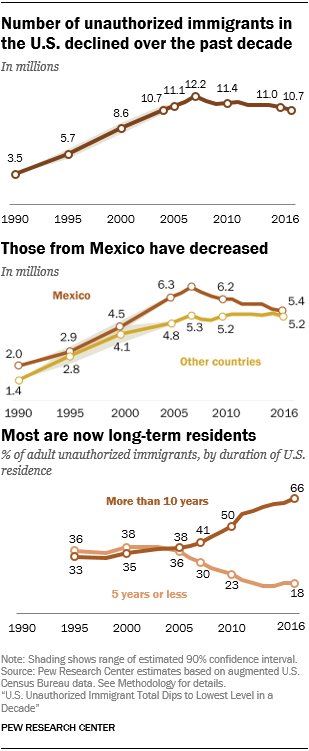
There were 10.7 million unauthorized immigrants living in the U.S. in 2016, down from a peak of 12.2 million in 2007, according to the new estimates.
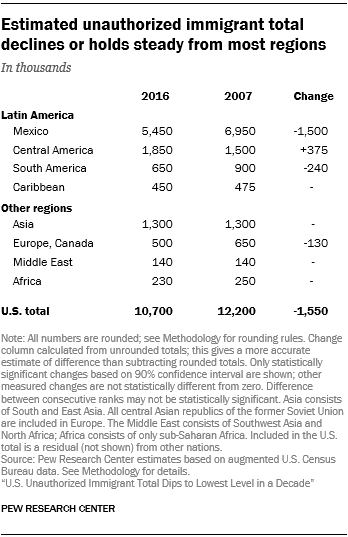
The total is the lowest since 2004. It is tied to a decline of 1.5 million people in the number of Mexican unauthorized immigrants from 2007 to 2016. Nevertheless, Mexico remains the country of origin for 5.4 million unauthorized immigrants, or roughly half of the U.S. total.
The declining overall number of unauthorized immigrants is due mainly to a very large drop in the number of new unauthorized immigrants, especially Mexicans, coming into the country. Consequently, today’s unauthorized immigrant population includes a smaller share of recent arrivals, especially from Mexico, than a decade earlier. Increasingly unauthorized immigrants are likely to be long-term U.S. residents: Two-thirds of adult unauthorized immigrants have lived in the country for more than 10 years.
As overall numbers declined, other related changes occurred in the unauthorized immigrant population. Between 2007 and 2016, the number of unauthorized immigrant workers fell, as did their share of the total U.S. workforce over the same period. So did the number of unauthorized immigrant men in the prime working ages of 18 to 44, but not women in that age group.
As their typical span of U.S. residence has grown, a rising share of unauthorized immigrant adults – 43% in 2016 compared with 32% in 2007 – live in households with U.S.-born children.
How did we estimate the U.S. unauthorized immigrant population?
Pew Research Center bases the estimates in this report on a “residual method” similar to those employed by the U.S. Department of Homeland Security’s Office of Immigration Statistics and nongovernmental organizations, such as the Center for Migration Studies and the Migration Policy Institute. Those organizations’ estimates are generally consistent with ours. Our estimates also align with official U.S. data sources, including birth records, school enrollment figures and tax data, as well as Mexican censuses and surveys.
The first step in our method is to use U.S. census counts and government surveys, such as the American Community Survey, to calculate how many immigrants live in the U.S. in a particular year. Next, we use official counts of immigrant admissions and other demographic data (death rates, for example) to determine how many of these immigrants live in the U.S. legally. Then we subtract those lawful immigrants from the total to get an estimate of the unauthorized immigrant population.
Based on experience and research, we know the census counts and other official surveys tend to miss some people. Unauthorized immigrants are especially likely to be missed. Therefore, we do a further assessment of potential undercounts or undercoverage. Based on this additional research, our final estimate of the U.S. unauthorized immigrant population includes an upward adjustment for undercount.
For more details, see Methodology.
Mexico’s historical significance as a source of U.S. immigration – authorized and especially unauthorized – overshadows that of other parts of the world, even after a decade of decline in unauthorized immigrants from that country. (For this reason, Mexico is treated as both a region and a country in this report for comparison purposes.) In the past decade, the number of unauthorized immigrants from South America and from Canada and Europe, combined, has declined, although by a smaller amount than from Mexico.
In the opposite direction, the number of unauthorized immigrants from Central America increased by 375,000 over the same 2007 to 2016 period. The 1.85 million Central American unauthorized immigrants in 2016 mainly came from the three Northern Triangle nations of El Salvador, Guatemala and Honduras, all of which registered increases since 2007.
Among the 20 largest birth countries, unauthorized immigrant totals also grew from India and Venezuela over the 2007-16 period. Meanwhile, there were statistically significant declines from Brazil, Colombia, Ecuador, Korea and Peru.
Overall, between 2007 and 2016, the unauthorized immigrant population shrank by 13%. By contrast, the lawful immigrant population grew 22% during the same period, an increase of more than 6 million people. In 2016, the U.S. was home to a total of 34.4 million lawful immigrants, both naturalized citizens and noncitizens on permanent and temporary visas.
More than a million unauthorized immigrants have temporary protection from deportation
Pew Research Center’s estimate of the U.S. unauthorized immigrant population includes more than a million people who have temporary permission to stay and work in the U.S. under two programs that could be rescinded, potentially exposing them to deportation.
As of Aug. 31, 2018, nearly 700,000 young adults who came to the U.S. illegally as children were recipients of Deferred Action for Childhood Arrivals. DACA was created by the Obama administration in 2012; the Trump administration announced in 2017 that the program would end, but it has been kept alive by court challenges.
 At least 317,000 people from 10 nations benefit from Temporary Protected Status, which is granted to visitors from countries where natural disaster or violence make it difficult to return. The Department of Homeland Security has announced plans to end protections for immigrants from six nations, including El Salvador, Honduras and Haiti, which account for the vast majority of the total.
The unauthorized immigrant estimates in this report also include some immigrants who applied for asylum status but whose applications had not yet been processed.
A rising share of unauthorized immigrants arrive legally, but overstay visas
Not all unauthorized immigrants enter the U.S. without documents, as is true of most Mexicans and Central Americans. Many arrive with legal visas but overstay their required departure date. Among unauthorized immigrants in the Center’s estimates who arrived in the previous five years, the share who are likely to be people who overstayed their visas probably grew substantially between 2007 and 2016 – to the point where they probably constituted most of the recent unauthorized immigrant arrivals in 2016.
The reference to “likely overstays” reflects the limits of the U.S. Census Bureau data that are the basis for these estimates; census data do not indicate whether unauthorized immigrants arrived with legal visas. But there is growing evidence about immigrants with expired visas from recent analyses by the U.S. Department of Homeland Security, which has produced three annual reports since 2016 analyzing statistics on the origins of immigrants who overstay and the types of visas they held. The latest report, for the 2017 fiscal year, estimated that more than 700,000 overstays should have left sometime during the year ending Sept. 30, 2017.
These official figures do not cover all arrivals and encompass only three years of data, which are not entirely comparable. For these and other reasons, they do not offer enough information on their own to say with certainty whether the overstay rate is growing, stable or declining. They do, however, indicate where the overstays are from. In contrast to border apprehensions, where 95% or more of immigrants are from Mexico and Central America, the vast majority of overstays – almost 90% – are from elsewhere.
A key indicator of the probable rise in the share of overstays among the unauthorized immigrant population comes from a Pew Research Center analysis comparing government overstay estimates and border apprehension statistics. For Mexico, there were almost four times as many apprehensions as overstays, even with the very large drops in Mexican apprehensions. For the three Northern Triangle nations, there were about 10 times as many apprehensions as overstays in 2015-17 government data.
For virtually every other country, overstays substantially exceed apprehensions. Taken together, for the rest of the world, the number of overstays was more than 30 times the number of border apprehensions.
Number of recent arrivals declines
The new Pew Research Center estimates indicate that not only is the total number of unauthorized immigrants shrinking, but that population includes markedly fewer people who arrived in the previous five years. Only 20% of all unauthorized immigrants (including both adults and children) in 2016 had arrived in the previous five years, compared with 32% in 2007.
An analysis of annual arrival flows for the years leading up to 2007 and 2016, using U.S. Census Bureau data, illustrates the downward trend in recently arrived unauthorized immigrants. There was an average of 386,000 annual arrivals for the 2011-16 period, compared with 715,000 for the 2002-07 period. That amounts to a 46% decline.
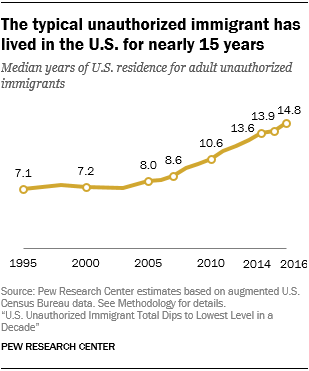
Increasingly, unauthorized immigrants are long-term U.S. residents. By 2016, an unauthorized immigrant adult had typically lived in the U.S. for 14.8 years, compared with a median 8.6 years in 2007.
Fewer recent arrivals from Mexico
The fall in recent arrivals is especially true for Mexicans – only 9% of unauthorized immigrants in 2016 had come to the U.S. in the previous five years, about half the share in the overall unauthorized immigrant population. Mexicans also were only about a quarter of all recent arrivals in 2016 compared with fully half in 2007.
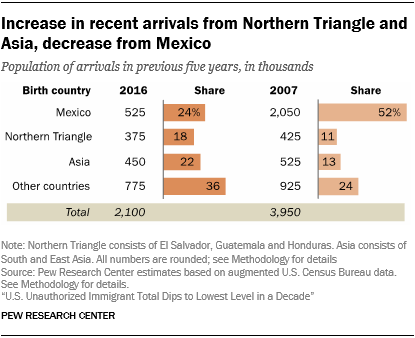 The number of recent arrivals from regions other than Mexico also declined, but less sharply. So as Mexicans became a shrinking share of recent arrivals, the share of all unauthorized immigrants who had arrived from Asia within the previous five years increased from 13% in 2007 to 22% in 2016. The share from the Northern Triangle nations in Central America grew from 11% to 18%. In addition, the share from the rest of the world (other than Asia, Central America and Mexico) rose to more than a third of recent arrivals in 2016, compared with about a quarter in 2007.
Border apprehensions of Mexicans decline, but rise for Central Americans
Apprehensions at the border do not exactly match attempts at unlawful entry, but enforcement officials and researchers view them as an indicator of entries. Annual apprehensions (sometimes the same person is caught more than once) peaked in 2000 at about 1.7 million before declining sharply. There were about 310,000 apprehensions in fiscal 2017, which includes part of the 2016 calendar year covered by these estimates.
The border apprehensions are almost all attempted entries by Mexicans and Central Americans from the three Northern Triangle countries; people from those four nations accounted for 95% of apprehensions in 2017 and 98% in 2007. Mexicans accounted for about 130,000 apprehensions in 2017, more than those from any other single country. This represents the smallest number of apprehensions of Mexicans since 1968 and is a drop of more than 80% from the 809,000 Mexicans apprehended in 2007, another indicator of the decline of Mexican unauthorized immigrants.
Meanwhile, apprehensions of Central Americans from the Northern Triangle more than tripled from 54,000 in 2007 to 165,000 in 2017 (but was still well below the peak of 239,000 in fiscal 2014). In fact, Northern Triangle apprehensions exceeded border apprehensions of Mexicans in 2014, 2016 and 2017 – something that had never happened before and which corroborates the rise in Central American unauthorized immigrants in the Center’s estimates. These apprehensions include those of unaccompanied children and families with children.
Deportations peaked in 2013
Deportations also can have an impact in limiting the size and growth of the unauthorized immigrant population. Deportations rose during the George W. Bush and Obama administrations – from 211,000 in 2003 to a record 433,000 in 2013, according to Department of Homeland Security statistics. They remained well above 300,000 a year through fiscal 2016, the last full year for which numbers are available. The vast majority of those deported were from Mexico and the three Northern Triangle nations in Central America.
Deportations appear to have declined since then, based on limited statistics. The number of immigrants deported by U.S. Immigration and Customs Enforcement within DHS – “removed” in government wording – declined 17% between fiscal 2016 and fiscal 2017, which ended Sept. 30, 2017. Nearly 230,000 unauthorized immigrants were removed, which included a decline in those detained at the U.S.-Mexico border as well as an increase in those arrested in the interior of the U.S., reflecting a shift in enforcement tactics.
About 5 million U.S.-born children live with unauthorized immigrant parents
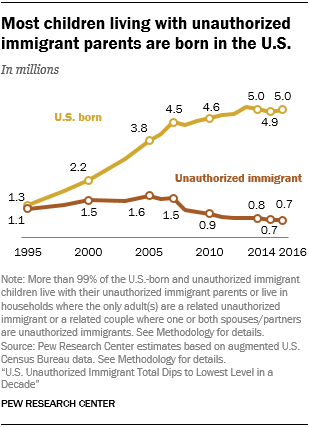 Most unauthorized immigrants live with spouses, partners, their children or other relatives. In 2016, 5.6 million children younger than 18 were living with unauthorized immigrant parents.5 Of these, 675,000 were unauthorized immigrants themselves, a number that has fallen by half since 2007. The other 5 million children were born in the U.S., a number that rose from 4.5 million in 2007. The number of U.S.-born children leveled off in recent years as births to unauthorized immigrants have dipped and an increasing number of children of unauthorized immigrants have aged into adulthood.
By 2016, 975,000 adult U.S.-born children of unauthorized immigrants were living with their parents. This total does not include U.S.-born children of unauthorized immigrants who live elsewhere.
Unauthorized immigrants lived in 5.2 million U.S. households in 2016 – about one in every 23 U.S. households, not much different from 2007. About 170,000 lived in group quarters such as college dormitories, hospitals and prisons.
Number and share of unauthorized immigrant workers declines
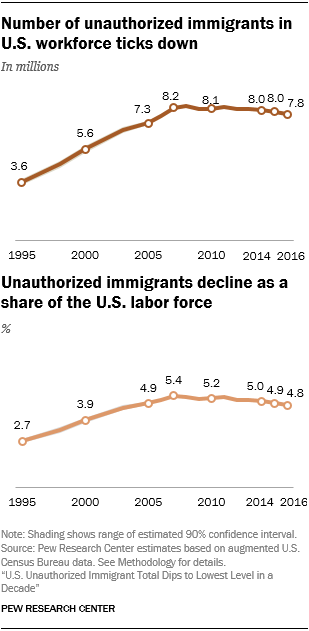 Just as with the population overall, the number of adult unauthorized immigrants in the workforce – 7.8 million – was lower in 2016 than a decade earlier. Their share of the workforce (4.8%) also declined from 2007. The decline in the unauthorized immigrant workforce stems mainly from the decline in the overall unauthorized immigrant population.
The decline in numbers came even though the labor force participation rate of unauthorized immigrants rose slightly from 2007 to 2016, as it did for both lawful immigrants and U.S.-born women, but not U.S.-born men.
Among occupations, unauthorized immigrants are a larger share of the workforce in low-skilled jobs such as farming (where they were about a quarter of the workforce in 2016) and construction (15%) than in higher-skilled categories.
The number of unauthorized immigrant workers in these lower-skilled occupational categories generally has declined since 2007. However, the number who work in management, business and professional jobs, a more skilled category, rose by a third, or 275,000 people, over the decade. Unauthorized immigrants make up only a small share of the overall workforce (2%) in this category.
Numbers changed in 15 states
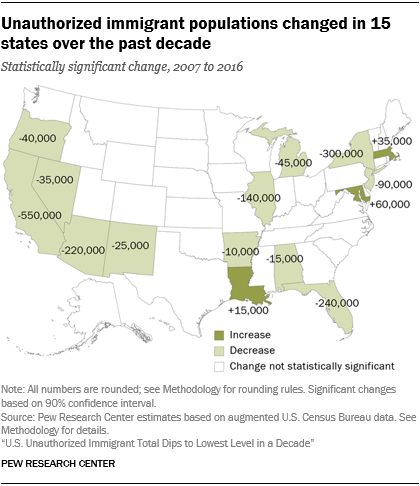 A dozen states registered declines in their populations of unauthorized immigrants since 2007: Alabama, Arizona, Arkansas, California, Florida, Illinois, Michigan, Nevada, New Jersey, New Mexico, New York and Oregon. Three had increases: Louisiana, Maryland and Massachusetts. In the remaining states, there may have been changes, whether up or down, but they fell within the margin of error and cannot be stated with statistical certainty.
The estimates in this report, while derived from U.S. Census Bureau data, differ from published statistics because we augment and adjust the data; see Methodology for details. All estimates in this report supersede previously published estimates.
Pew Research Center U.S. Unauthorized Immigrants Total Dips 2018-11-27 by Latinos Ready To Vote