Downloads PDF (326.45 KB)
Since taking office in 2017, President Trump has expanded interior immigration enforcement, made it easier for states and local governments to apprehend and detain illegal immigrants, and argued that building a wall is essential to reducing crime. These actions are largely based on the perception that illegal immigrants are a significant and disproportionate source of crime in the United States. This brief uses American Community Survey data from the U.S. Census to analyze incarcerated immigrants according to their citizenship and legal status in 2017. The data show that all immigrants—legal and illegal—are less likely to be incarcerated than native-born Americans relative to their shares of the population. By themselves, illegal immigrants are less likely to be incarcerated than native-born Americans.
President Trump has expanded immigration enforcement on the border and in the interior of the United States largely based on the perception that illegal immigrants are a significant and disproportionate source of crime.1 In response to that perception, we published the first nationwide estimates of the incarcerated illegal immigrant population in 2017, followed quickly by an update in 2018.2 The 2017 brief analyzed incarceration rates for 2014, and the 2018 brief analyzed incarceration rates for 2016. The public demand for those briefs was so large that it prompted us to update the estimates using the most recent 2017 inmate data from the U.S. Census’s American Community Survey (ACS). Estimates of the total criminal immigrant population vary widely in other sources, but the number of incarcerated illegal immigrants is an important indicator of their criminality.3
Previous empirical studies of immigrant criminality generally find that immigrants do not increase local crime rates, are less likely to cause crime than their native-born peers, and are less likely to be incarcerated than native-born Americans.4 Illegal immigrant incarceration rates are not well studied; however, Cato Institute research based on data from the Texas Department of Public Safety found that, as a percentage of their respective populations, illegal immigrants represented 50 percent fewer criminal convictions than native-born Americans in Texas in 2015.5 Recent peer-reviewed empirical studies have found no link between violent crime and illegal immigration, and a negative relationship between the number of illegal immigrants and most types of nonviolent crime.6 Our estimate of a low illegal immigrant incarceration rate is consistent with other research that finds that increasing immigration enforcement and deporting more illegal immigrants do not reduce the crime rate, which would occur if they were more prone to crime than natives.7
Methodology
This brief uses ACS data to estimate the incarceration rate and other demographic characteristics for immigrants ages 18-54 in 2017. ACS inmate data are reliable, as they are ordinarily collected by or under the supervision of correctional institution administrators; however, the quality of the data for the population that includes the incarcerated was not always so reliable. The response rate for the group quarters population-a subpopulation who live in facilities that are owned and managed by others, which includes prisoners incarcerated in correctional facilities-was low in the 2000 Census.8 Recognizing the problem with data collected from the group quarters population, the Census substantially resolved it in the 2010 Census and in the ACS by making several tweaks over the years that have continually improved the size and quality of the group-quarters sample.9
The ACS counts the incarcerated population by their nativity and naturalization status, but local and state governments rarely record whether prisoners are illegal immigrants.10 As a result, we have to use common statistical methods to identify incarcerated illegal immigrant prisoners by excluding prisoners with characteristics that illegal immigrants are unlikely to have.11 In other words, we can identify likely illegal immigrants by looking at prisoners with individual characteristics highly correlated with being an illegal immigrant. Following guidance set by other researchers, those characteristics are: the immigrant must have entered the country after 1982 (the cutoff date for the 1986 Reagan amnesty); cannot have been in the military; cannot be receiving Social Security or Railroad Retirement Income; cannot have been covered by Veteran Affairs or Indian Health Services; is not a citizen of the United States; was not living in a household where someone received food stamps (unless the immigrant’s child, who may be eligible for food stamps if a U.S. citizen, is living with the immigrant); is not from the Democratic Republic of the Congo or Syria; was age 59 years or younger on arrival; and is not of Puerto Rican or Cuban origin if classified as Hispanic.
The criteria above that we used to identify illegal immigrants would also include those on Temporary Protected Status (TPS), a form of lawful residency. As a result, we used a different residual method to separate TPS holders from the illegal immigrant population and added them to the legal immigrant population to produce a more accurate estimate. We identified TPS recipients by birthplace, year of migration, and citizenship status. We imputed likely TPS recipient status to individuals from El Salvador (year of arrival 2001 or earlier); Honduras (1998 or earlier); Nicaragua (1998 or earlier); Haiti (2011 or earlier); Nepal (2015 or earlier); Somalia (2012 or earlier); Sudan (2013 or earlier); South Sudan (2016 or earlier); Syria (2016 or earlier); and Yemen (2017 or earlier).12 Despite our effort to count TPS holders as legal immigrants, some other legal immigrants whose answers are consistent with those given by illegal immigrants will be counted as illegal immigrants despite their legal immigration status. As a result, we likely overestimate the number of illegal immigrants who are incarcerated and resident in the United States. Thus, because of the ACS’s data limitations, our estimates of the incarcerated illegal immigrant population and incarceration rate are likely greater than the actual population and rate.
Another limitation of the ACS data is that not all inmates in group quarters are in correctional facilities. Although most inmates in the public-use microdata version of the ACS are in correctional facilities, the data also include those in mental health and elderly care institutions, as well as those in institutions for people with disabilities.13 These inclusions add ambiguity to our findings about the illegal immigrant population but not about the immigrant population as a whole, because the ACS releases macrodemographic snapshots of inmates in correctional facilities, which allows us to check our work.14
The ambiguity in illegal immigrant incarceration rates mentioned above prompted us to narrow the age range to those who are ages 18-54. This age range excludes most inmates in mental health and retirement facilities. Few prisoners are under age 18, many in mental health facilities are juveniles, and many of those over age 54 are in elderly care institutions. Additionally, few illegal immigrants are elderly, whereas those in elderly care institutions are typically over age 54.15 As a result, narrowing the age range does not exclude many individuals from our analysis. We are more confident that our methods do not cut out many prisoners because winnowing the 18-54 age range reduces their numbers to about 4.5 percent above that of the ACS snapshot.16 Natives in our results include both those born in the United States and those born abroad to American parents.
Controlling for the size of the population is essential for comparing relative incarceration rates between the native-born, illegal immigrant, and legal immigrant subpopulations. Thus, we report the incarceration rate as the number of incarcerations per 100,000 members of that particular subpopulation, just as most government agencies do.17
Incarcerations
An estimated 1,926,390 native-born Americans, 106,431 illegal immigrants, and 52,424 legal immigrants were incarcerated in 2017. The incarceration rate for native-born Americans was 1,471 per 100,000; 756 per 100,000 for illegal immigrants; and 364 per 100,000 for legal immigrants in 2017 (Figure 1). Illegal immigrants are 49 percent less likely to be incarcerated than native-born Americans. Legal immigrants are 75 percent less likely to be incarcerated than natives. If native-born Americans were incarcerated at the same rate as illegal immigrants, about 943,000 fewer natives would be incarcerated. Conversely, if natives were incarcerated at the same rate as legal immigrants, about 1.45 million fewer natives would be in adult correctional facilities.
Figure 1
Incarceration rates by immigration status, ages 18-54
Source: Authors’ analysis of the American Community Survey data.
Note: Rates are per 100,000 residents in each subpopulation.
The ACS data include illegal immigrants incarcerated for immigration offenses and in Immigration and Customs Enforcement (ICE) detention facilities.18 Removing the immigration offenders by subtracting the 13,000 convicted for immigration offenses and the 38,000 in ICE detention facilities on any given day lowers the illegal immigrant incarceration rate to 397 per 100,000-only 9 percent above the incarceration rate for legal immigrants.19
Robustness Checks for Counting the Illegal Immigrant Population
Because our chosen ACS variables could have affected the number of illegal immigrants we identified in the data, we altered some of the variables to see if the results significantly changed. First, we included illegal immigrants who lived in households with users of means-tested welfare benefits. Illegal immigrants do not have access to these benefits, but U.S. citizens and some lawful permanent residents in their households do. This adjustment dropped the illegal immigrant incarceration rate to 756 per 100,000; the legal immigrant incarceration rate remained at 364 per 100,000; and the adjustment did not affect the native incarceration rate.
Our second robustness check excluded all immigrants who entered the United States after 2008. Immigrants on lawful permanent residency can apply for citizenship after five years, guaranteeing that most of the lawful permanent residents who are able to naturalize have done so, which decreases the pool of potential illegal immigrants in our sample. This robustness check shrinks the size of the nonincarcerated illegal immigrant subpopulation relative to those incarcerated, and thus slightly raises the rate of illegal immigrant incarceration rate to about 855 per 100,000. These variable changes did not alter our results enough to undermine our confidence in the findings.
Demographic and Social Characteristics
Incarceration rates vary widely by race and ethnicity in the United States, even within each immigrant category (Table 1). By race and ethnicity, legal and illegal immigrants have a lower incarceration rate than native-born Americans of the same race or ethnicity. The incarceration rate for all illegal immigrants is lower than the incarceration rate for native-born white Americans.
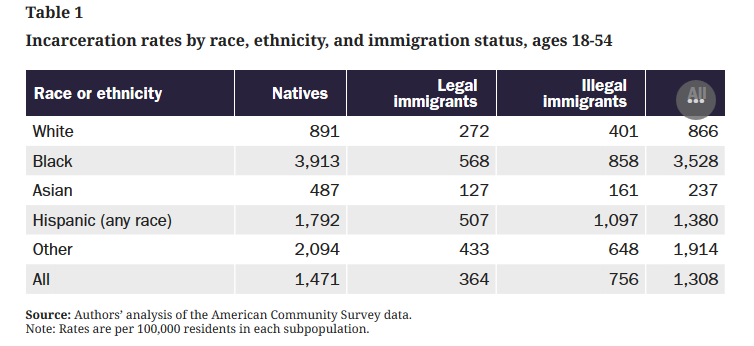
Immigrants from certain parts of the world are more likely to be incarcerated than others (Table 2). Of all legal immigrants, those from “Other” countries have the highest incarceration rate. For illegal immigrants, those from Latin America have the highest incarceration rate of any group, in part because they are more likely to be incarcerated for immigration offenses and held in ICE detention facilities than immigrants from any other region. Across all broad groups, those born in other countries have the highest or second-highest incarceration rates, followed by those born in the United States. About 67 percent of all immigrants in the United States come from the top 20 countries of origin for the foreign-born population.20 Of those, legal and illegal immigrants from Honduras have the highest incarceration rates (Table 3). The higher incarceration rates for illegal immigrants from Mexico, El Salvador, Guatemala, and Honduras are likely exacerbated by the significant number of them who are detained for immigration offenses.
Table 2
Incarceration rates by region of birth and immigration status, ages 18-54
Source: Authors’ analysis of the American Community Survey data.
Note: Rates are per 100,000 residents in each subpopulation; N/A = not applicable.
Table 3
Incarceration rates by country of birth and immigration status, ages 18-54
Source: Authors’ analysis of the American Community Survey data.
Note: Rates are per 100,000 residents in each subpopulation.
The distribution of prisoners by their immigration status and region of origin shows that 6.36 percent of all prisoners are from Latin America, whereas 91.76 percent were born in the United States (Table 4).
Table 4
Percentage of all prisoners by region of birth and immigration status, ages 18-54
Source: Authors’ analysis of the American Community Survey data.
Note: N/A = Not applicable.
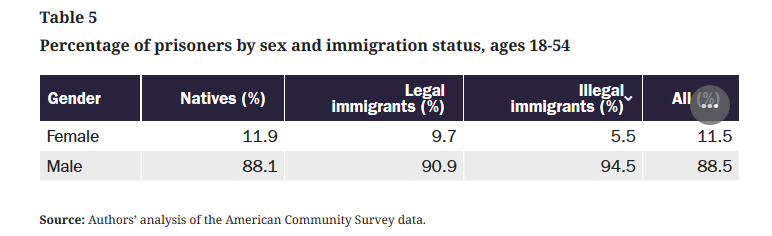
About 88.5 percent of all prisoners are men, whereas only 11.5 percent are women (Table 5). Legal and illegal immigrant women make up a smaller proportion of their respective prisoner populations than native-born women, while men make up a higher proportion. The sex distribution of legal immigrant prisoners is far closer to that of native-born Americans than to that of illegal immigrants.
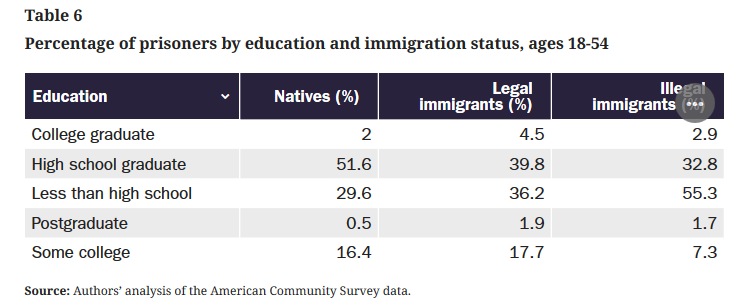
Prisoners in every subpopulation are less educated than their total subpopulation (Table 6). The percentage of all adult natives who have at least some college education, including those not incarcerated, is 62.4 percent, whereas 18.8 percent of native-born prisoners have the same level of education. A total of 24.8 percent of legal immigrant prisoners and 12.1 percent of illegal immigrant prisoners have at least some college education; those percentages are lower than the percentages of their respective subpopulations with the same level of education.21 Those in every immigration category who are highly educated tend to avoid incarceration.
Native-born Americans and illegal immigrants have higher incarceration rates when they are young (Table 7). The peak incarceration rate for natives is between ages 35 and 39, and it is between ages 25 and 29 for illegal immigrants. The legal immigrant incarceration rate varies much less over time, peaking between ages 30 and 34. The incarceration rates for legal and illegal immigrants generally increase with the amount of time that they have spent in the United States. The exception is the substantially higher incarceration rates for illegal immigrants who have been in the United States for four years or less, a rate that likely reflects the number of illegal immigrants who were detained shortly after entering the country (Table 8).
Table 7
Incarceration rates by age and immigration status, ages 18-54
Source: Authors’ analysis of the American Community Survey data.
Note: Rates are per 100,000 residents in each subpopulation.
Table 8
Incarceration rates by time in the United States and immigration status, ages 18-54
Source: Authors’ analysis of the American Community Survey data.
Note: Rates are per 100,000 residents in each subpopulation; N/A = Not applicable.
Related to the amount of time immigrants have spent in the United States, illegal and legal immigrants who immigrate at a younger age are more likely to be incarcerated (Table 9). Illegal immigrants who arrive between ages 0 and 17 are 286 percent more likely to be incarcerated than those who arrive at later ages, suggesting that illegal immigrants who were old enough to choose to come illegally are more law-abiding than those who were brought here as minors.
Table 9
Incarceration rates for immigrants by their age of arrival in the United States and immigration status, ages 18-54
Source: Authors’ analysis of the American Community Survey data.
Note: Rates are per 100,000 residents in each subpopulation.
The pattern is even more pronounced for legal immigrants: those who immigrated between ages 0 and 17 were 231 percent more likely to be incarcerated than legal immigrants who came at later ages, again suggesting that those old enough to choose to come legally to the United States are more law-abiding. At least two nonmutually exclusive theories can explain why those who entered in their youth have higher incarceration rates. First, spending part of one’s childhood in the United States assimilates many immigrants to our high-crime culture. A second theory is that those who decide to come here have some systematically different characteristics that make them less likely to commit crimes, whereas those who are too young to make the decision to immigrate do not.
Conclusion
Legal and illegal immigrants were less likely to be incarcerated than native-born Americans in 2017, just as they were in 2014 and 2016.22 Those incarcerated do not represent the total number of immigrants who can be deported under current law or the complete number of convicted immigrant criminals who are in the United States, but merely those who are incarcerated. The younger the immigrants are upon their arrival in the United States, and the longer that they are here, the more likely they are to be incarcerated as adults. This brief provides numbers and demographic characteristics to better inform the public policy debate over immigration and crime.
Notes
1. “Executive Order: Enhancing Public Safety in the Interior of the United States,” (whitehouse.gov), Executive Order of the President, January 25, 2017; David Nakamura, “ ‘Crime Will Fall!’: Trump’s New Rallying Cry for Border Wall Echoes Old Strategy of Inflating Dangers Posed by Immigrants,” Washington Post, January 23, 2019; and Lesley Stahl, “President-Elect Trump Speaks to a Divided Country on 60 Minutes,” CBS News, November 13, 2016.
2. Michelangelo Landgrave and Alex Nowrasteh, “Criminal Immigrants: Their Numbers, Demographics, and Countries of Origin,” Cato Institute, Immigration Research and Policy Brief no. 1, March 15, 2017; and Michelangelo Landgrave and Alex Nowrasteh, “Incarcerated Immigrants in 2016: Their Numbers, Demographics, and Countries of Origin,” Cato Institute, Immigration Research and Policy Brief no. 7, June 4, 2018.
3. U.S. Department of Homeland Security, “U.S. Immigration and Customs Enforcement Salaries and Expenses,” Congressional Submission (Washington: Department of Homeland Security, 2013), p. 61; and Marc R. Rosenblum, “Understanding the Potential Impact of Executive Action on Immigration Enforcement,” Migration Policy Institute, July 2015, p. 11.
4. Graham C. Ousey and Charis E. Kubrin, “Immigration and Crime: Assessing a Contentious Issue,” Annual Review of Criminology 1, no. 1 (2018): 63-84; Kristin F. Butcher and Anne Morrison Piehl, “The Role of Deportation in the Incarceration of Immigrants,” in Issues in the Economics of Immigration, ed. George J. Borjas (Chicago: University of Chicago Press, 2000), pp. 351-86; Kristin F. Butcher and Anne Morrison Piehl, “Why Are Immigrants’ Incarceration Rates So Low? Evidence on Selective Immigration, Deterrence, and Deportation,” NBER Working Paper no. 13229, National Bureau of Economic Research, July 2007; and Alex Nowrasteh, “Immigration and Crime—What the Research Says,” Cato at Liberty (blog), July 14, 2015.
5. Alex Nowrasteh, “Criminal Immigrants in Texas: Illegal Immigrant Conviction and Arrest Rates for Homicide, Sexual Assault, Larceny, and Other Crimes,” Cato Institute, Immigration Research and Policy Brief no. 4, February 26, 2018.
6. Michael L. Light and Ty Miller, “Does Undocumented Immigration Increase Violent Crime?,” Criminology 56, no. 2 (May 2018): 370-401; and Michael T. Light, Ty Miller, and Brian C. Kelly, “Undocumented Immigration, Drug Problems, and Driving Under the Influence in the United States, 1990-2014,” American Journal of Public Health 107, no. 9 (September 2017): 1448-54.
7. Thomas J. Miles and Adam B. Cox, “Does Immigration Enforcement Reduce Crime? Evidence from Secure Communities,” Journal of Law and Economics 57, no. 4 (2014): 937-73; Elina Treyger, Aaron Chalfin, and Charles Loeffler, “Immigration Enforcement, Policing, and Crime,” Criminology & Public Policy 13, no. 2 (2014): 285-322; and Andrew Forrester and Alex Nowrasteh, “Do Immigration Enforcement Programs Reduce Crime? Evidence from the 287(g) Program in North Carolina,” Cato Institute, Cato Working Paper no. 52, April 11, 2018.
8. Constance F. Citro, Daniel L. Cork, and Janet L. Norwood, eds., The 2000 Census: Counting Under Adversity (Washington: National Academies Press, 2004), pp. 297, 488.
9. Constance F. Citro and Graham Kalton, eds., Using the American Community Survey: Benefits and Challenges (Washington: National Academies Press, 2007), pp. 170-73.
10. Steven Ruggles et al., “Integrated Public Use Series: Version 6.0,” (Minneapolis: University of Minnesota, 2015).
11. Enrico A. Marcelli and David M. Heer, “The Unauthorized Mexican Immigrant Population and Welfare in Los Angeles County: A Comparative Statistical Analysis,” Sociological Perspectives 41, no. 2 (1998): 279-302; Robert Warren, “Democratizing Data about Unauthorized Residents in the United States: Estimates and Public-Use Data, 2010 to 2013,” Journal on Migration and Human Security 2, no. 4 (2014): 305-28; and Pia M. Orrenius and Madeline Zavodny, “Do State Work Eligibility Verification Laws Reduce Unauthorized Immigration?,” IZA Journal of Migration5, no. 1 (2016): 1-17.
12. Robert Warren and Donald Kerwin, “A Statistical and Demographic Profile of the U.S. Temporary Protected Status Populations from El Salvador, Honduras, and Haiti,” Journal on Migration and Human Security 5, no. 3 (August 9, 2018): 577-92.
13. Butcher and Piehl, “The Role of Deportation in the Incarceration of Immigrants”; Butcher and Piehl, “Why Are Immigrants’ Incarceration Rates So Low?”
14. American Community Survey, “Characteristics of the Group Quarters Population by Group Quarters Type (3 Types),” Table S2602 5-Year Estimates, 2017.
15. Jeffrey S. Passel and D’Vera Cohn, “A Portrait of Unauthorized Immigrants in the United States,” Pew Research Center, April 14, 2009.
16. American Community Survey, “Characteristics of the Group Quarters Population by Group Quarters Type (3 Types),” Table S2602 5-Year Estimates, 2017.
17. Patrick A. Langan, Ph.D. and David P. Farrington, Ph.D., “Crime and Justice in the United States and in England and Wales, 1981-1996,” Bureau of Justice Statistics (October, 1998).
18. 2017 American Community Survey/Puerto Rico Community Survey Group Quarters Definition.
19. Laurel Wamsley, “As It Makes More Arrests, ICE Looks for More Detention Centers,” National Public Radio (NPR.org), October 26, 2017; and “Quick Facts: Federal Offenders in Prison—February 2017,” United States Sentencing Commission.
20. American Community Survey, “Place of Birth for the Foreign-Born Population in the United States,” Table B05006 5-Year Estimates, 2017.
21. Passel and Cohn, “A Portrait of Unauthorized Immigrants in the United States.”
22. Landgrave and Nowrasteh, “Criminal Immigrants: Their Numbers, Demographics, and Countries of Origin.”
Michelangelo Landgrave is a doctoral student in political science at the University of California, Riverside. Alex Nowrasteh is a senior immigration policy analyst at the Cato Institute’s Center for Global Liberty and Prosperity.