by admin
In its first year of implementation, did the Voter’s Choice Act (VCA) change turnout patterns in the counties – Madera, Napa, Nevada, Sacramento, and San Mateo – that adopted this new reform? How did this reform affect the turnout of groups of Californians – young voters, Latinos, and Asian Americans– who have often participated in elections at lower rates than others? We address these questions by gathering data on turnout rates, voter demographics, and electoral competition from 2002 through the primary and general elections of 2018, comparing trends in the adopting counties to the rest of the state.
How Did the VCA Affect Turnout of Young, Latino, and Asian-American Voters?
An important question about the impact of the VCA on the representativeness of California elections is whether the increase that it appears to have brought to voter turnout overall was shared by all types of voters, especially those who have traditionally participated at lower rates. In this section, we focus on three groups that have often seen less representation in California’s electorate than in its population of eligible voters: young voters (aged 18-24), Latinos, and Asian-American voters. We find that turnout for voters in these groups generally rose more sharply from 2014 to 2018 in counties adopting the VCA than it did in other counties, following similar patterns to the trend for voters overall.
All of our analyses look at the estimated turnout of eligible voters in these groups, the most comprehensive measure of voter participation. To calculate these estimates, we begin with figures on the number of eligible voters in each group in each county during each year, provided to us by the California Department of Finance Demographic Unit. That provides our denominator. Our numerator comes from data from the California Statewide Database in 2010, 2014, and the 2018 primary election. Because data from this source are not yet available for the 2018 general election, we use figures from Political Data, Incorporated for that election. Young voters are identified in each year through the self-reported birth dates, with voters aged between 18 and 24 years considered young. Latino and Asian-American voters are estimated through their surnames (in the data taken from the Statewide Database) and from their surnames, birthplaces, and the demographic characteristics of the areas in which they live (in the 2018 general election data from Political Data, Incorporated). We use these figures to calculate participation rates for each group in each county in each election, and then average across both adopting and non-adopting counties, just as in our analysis of voters overall. Because some of these groups are so small in some counties, we omit data from counties with fewer than 100 eligible voters in a group in 2014 or with missing data in any election, dropping one county from our analysis of young voters, four counties from our analysis of Latino voters, and five counties from our analysis of Asian-American voters.
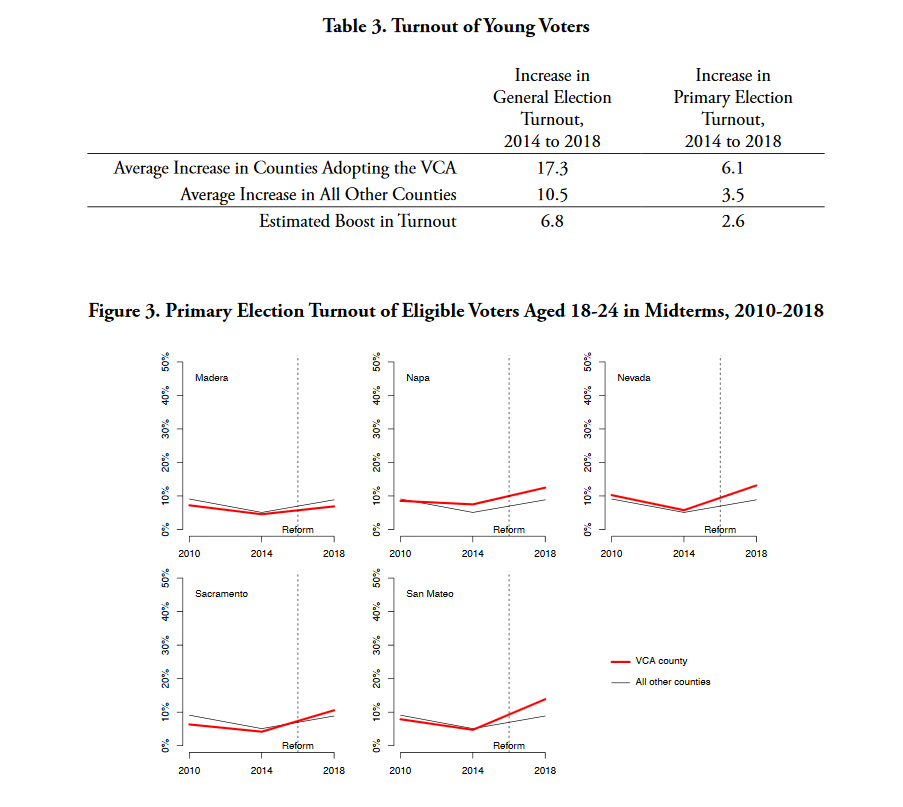
In Tables 3, 4, and 5, we compare turnout increases between 2014 and 2018 for the five counties that adopted the VCA to the rises in other counties. The difference between these increases yields our estimate of the impact of the reform’s adoption. For young voters, the rise in turnout in the 2018 General Election was especially steep in the counties that adopted the VCA, outpacing other counties by 6.8 percentage points. The increase in primary turnout was also steeper, surpassing the increase in non-adopting counties by 2.6 percentage points. Figure 3 shows that this accelerated rise in turnout occurred in nearly every adopting county. In our statistical models, we estimate that VCA adoption increased the turnout of eligible voters aged 18-24 in the general election by 6.2 percentage points, with 99% confidence of at least some effect. In the primary election, we estimate an increase in youth turnout of 3.0 percentage points, with 71% confidence of at least some effect.
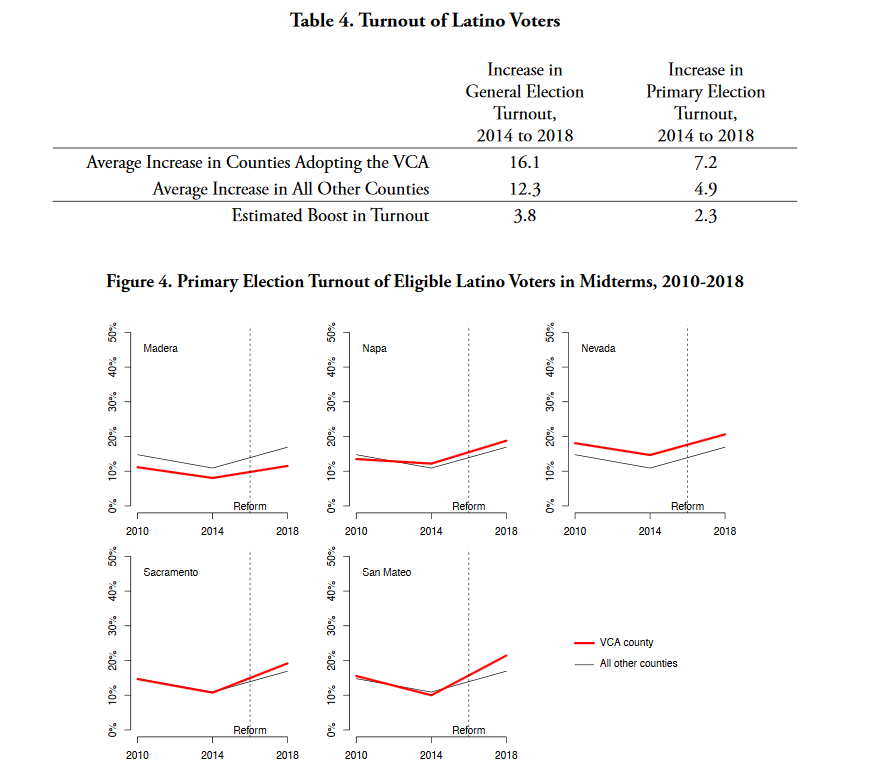
For Latino voters, the rise in turnout in the 2018 General Election was steeper in the counties that adopted the VCA than in other counties, outpacing that rise by 3.8 percentage points. The increase in primary turnout was marginally steeper, surpassing the increase in non-adopting counties by 2.3 percentage points. Figure 4 shows that this accelerated rise in turnout occurred in four of the five adopting counties. In our statistical models, we estimate that VCA adoption increased the turnout of Latino eligible voters in the general election by 2.5 percentage points, with 83% confidence of at least some effect. In the primary election, we estimate an increase in Latino turnout of 2.5 percentage points, with 94% confidence of at least some effect.
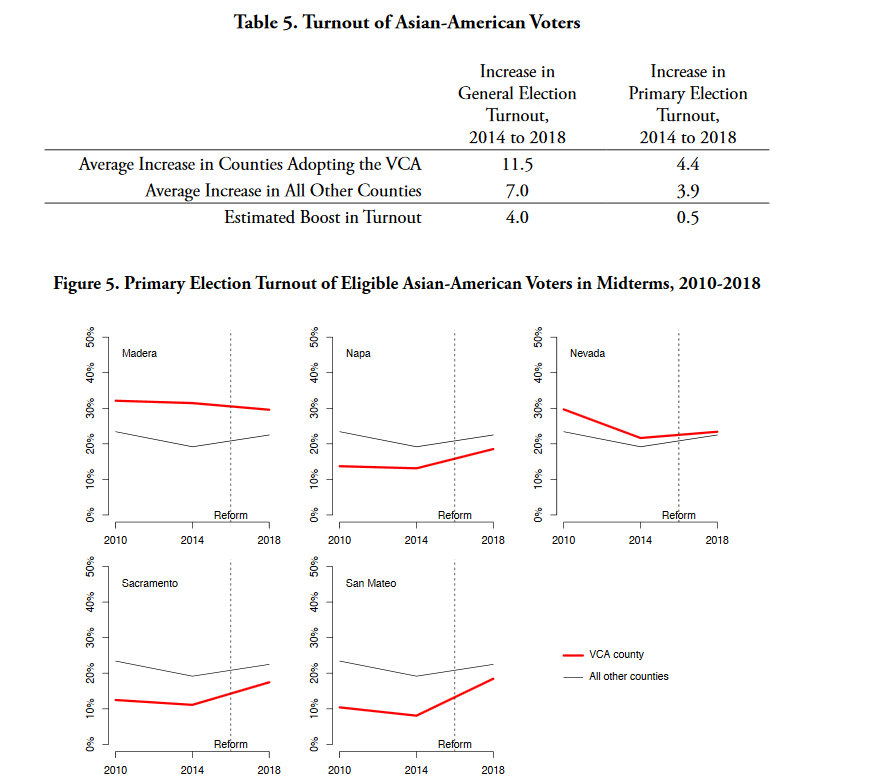
Finally, for Asian-American voters, we find a positive but, in the primary election, weaker impact of the adoption of the VCA. The rise in turnout in the 2018 General Election was steeper in the counties that adopted the VCA than in other counties, outpacing that rise by 4.0 percentage points. But the effect for primary turnout was much weaker, exceeding the average of other counties by only 0.5 percentage points. Figure 5 shows that three of the five counties saw a disproportionate turnout increase in the primary, while one actually saw a turnout decline. In our statistical models, we estimate that VCA adoption increased the turnout of Asian-American eligible voters in the general election by 4.6 percentage points, with 66% confidence of at least some effect. In the primary election, we estimate an increase in Asian-American turnout of 1.4 percentage points, with 38% confidence of at least some effect. With all of our analyses of small groups of voters, one year of implementation of the VCA can yield only preliminary lessons about its effects on turnout. Our statistical models indicate less confidence in estimates of the impact of VCA adoption on Latino and Asian-American voters because these turnout rates vary significantly across counties and across years. The concentrations of young, Latino, and Asian-American voters vary across the counties, and differ between the five counties that adopted it in 2018 and the rest of the state. All of these factors suggest that more experience with the implementation of the VCA is necessary in order to draw firm conclusions about its effect on voters in each of these groups.
Conclusion
In order to evaluate the impact of the VCA on participation in the 2018 elections, it is important to make careful comparisons. Because the five counties that adopted it had high turnout even before 2018, simply comparing their participation rates to those of other counties does not isolate the impact of the reform. Because turnout in 2018 was so much stronger all across California than it was in 2014, simply looking at the increase in turnout in the VCA counties from one midterm election to the next does not tell the full story, either. Instead, our analysis compares the increase in turnout from 2014 to 2018 in the VCA counties, compared with the average turnout increase in all other counties, in order to determine whether the reform in fact boosted participation. We find that the VCA’s adoption in 2018 led to modest yet significant increases in turnout by eligible voters of approximately three percentage points in the primary and general elections. Importantly, the rise in turnout among voters overall appears to be present as well in most of the groups we looked at that have had low levels of representation in California’s electorate. For young voters, Latinos, and to a lesser extent Asian-Americans, turnout also rose faster in the counties that adopted the VCA.
Download full report here
About the study: This research study continues beyond the publication of this brief. We will further explore possible factors that could help explain the findings of a turnout increase in VCA counties. The next phase of our research will be submitted for publication in late Spring of 2019.