by Alex Gonzalez
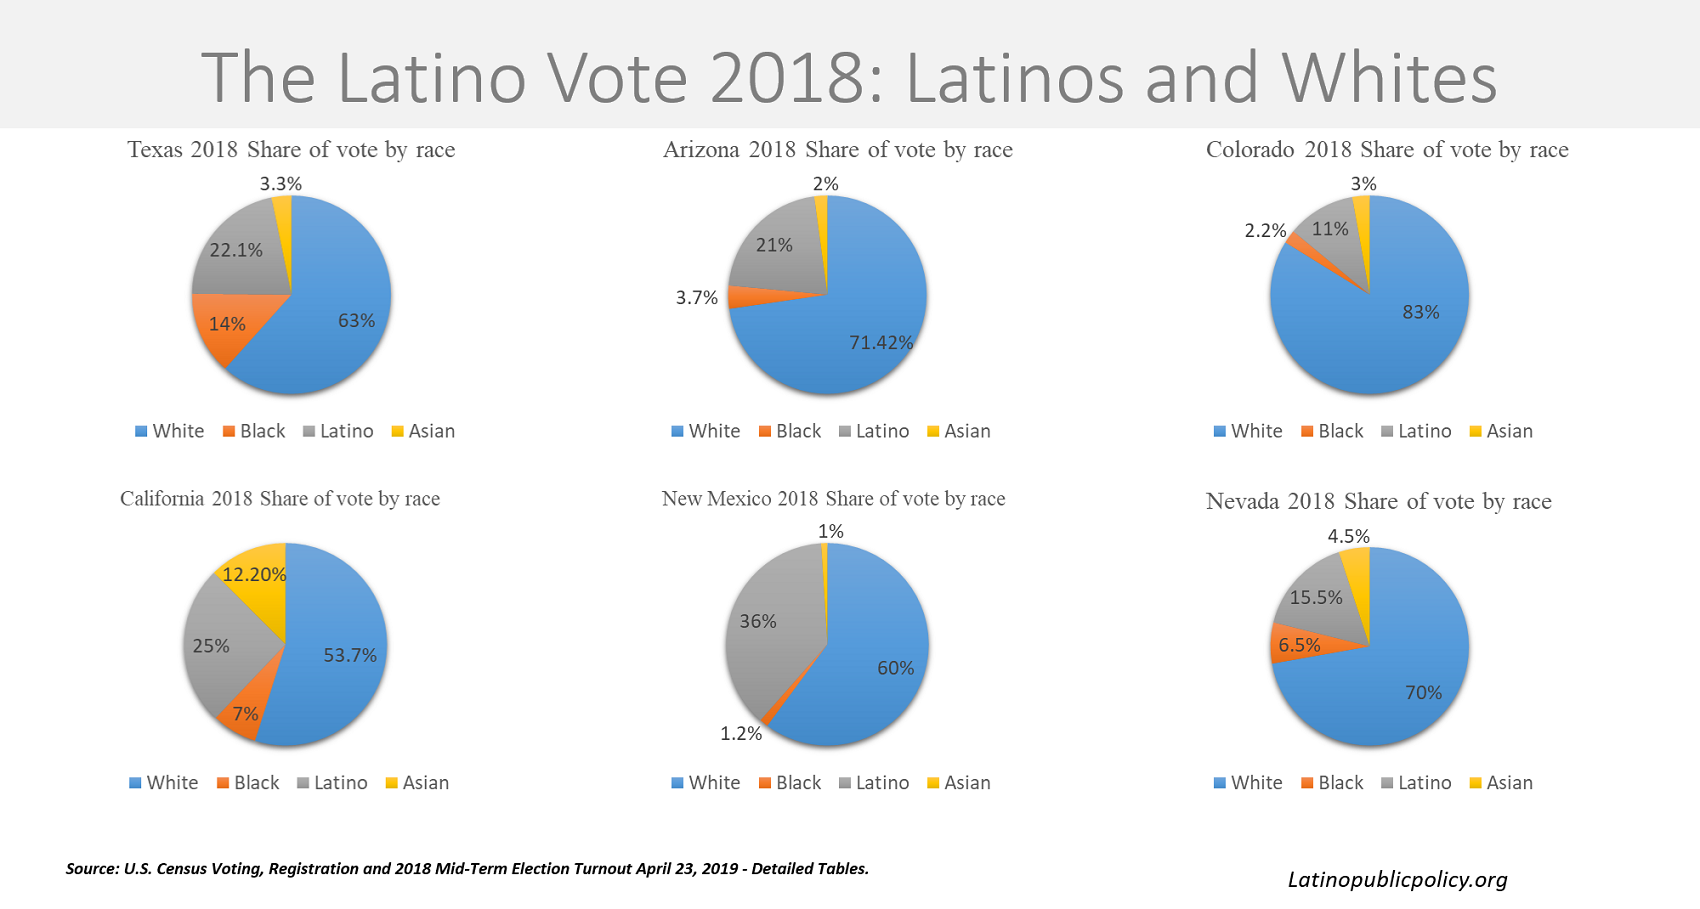
These are the New Census Bureau data results from the 2018 Mid-Term Voting and Registration among Latino voters that were released this week. These are charts for all the six states in the Southwest where most Latinos reside; the charts include the total population of Latinos, citizens voting age populations, registered voters, and actual turnout. The pie charts on the right show the share of the Latino Vote in every state and other racial groups.
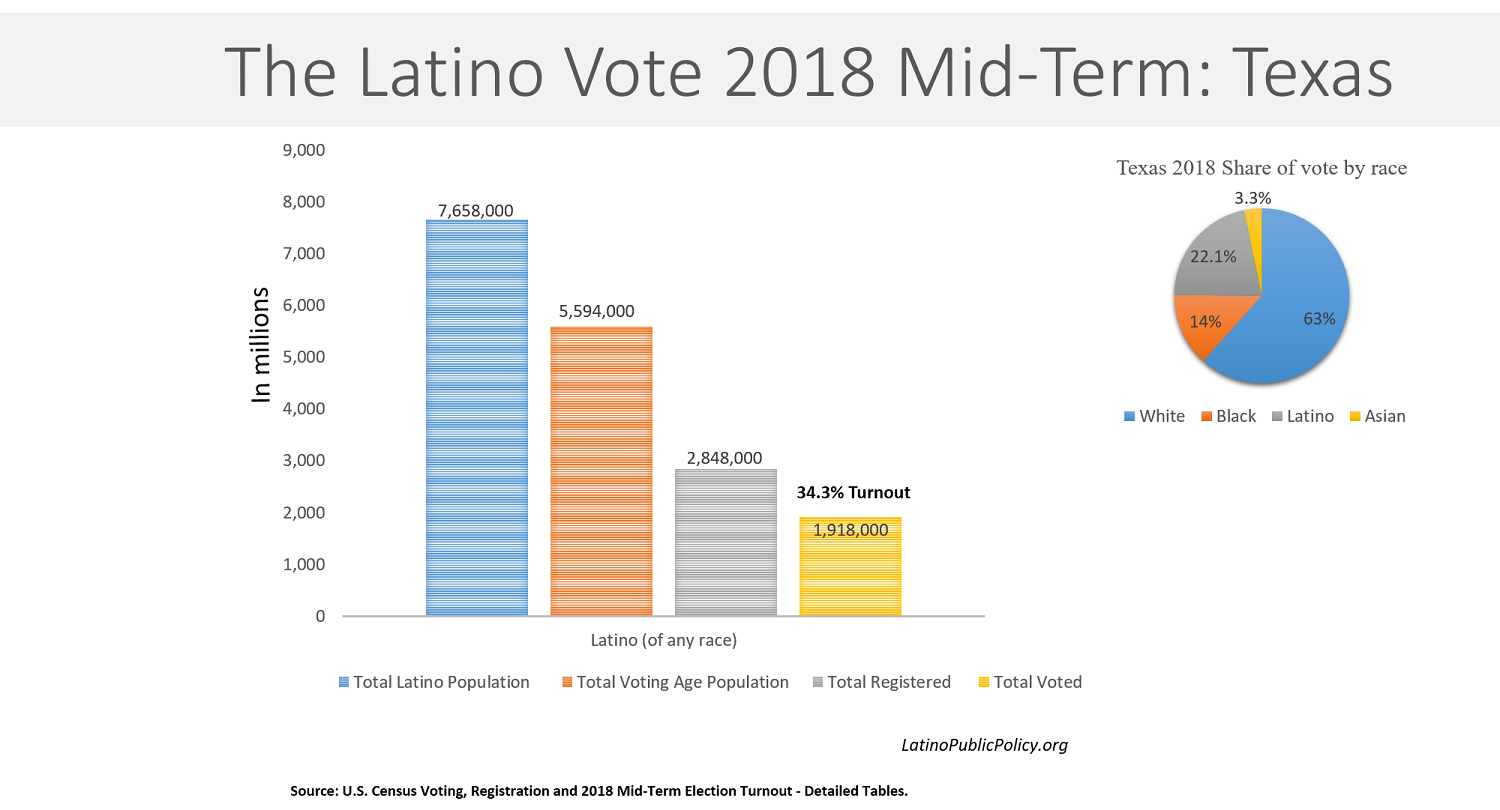
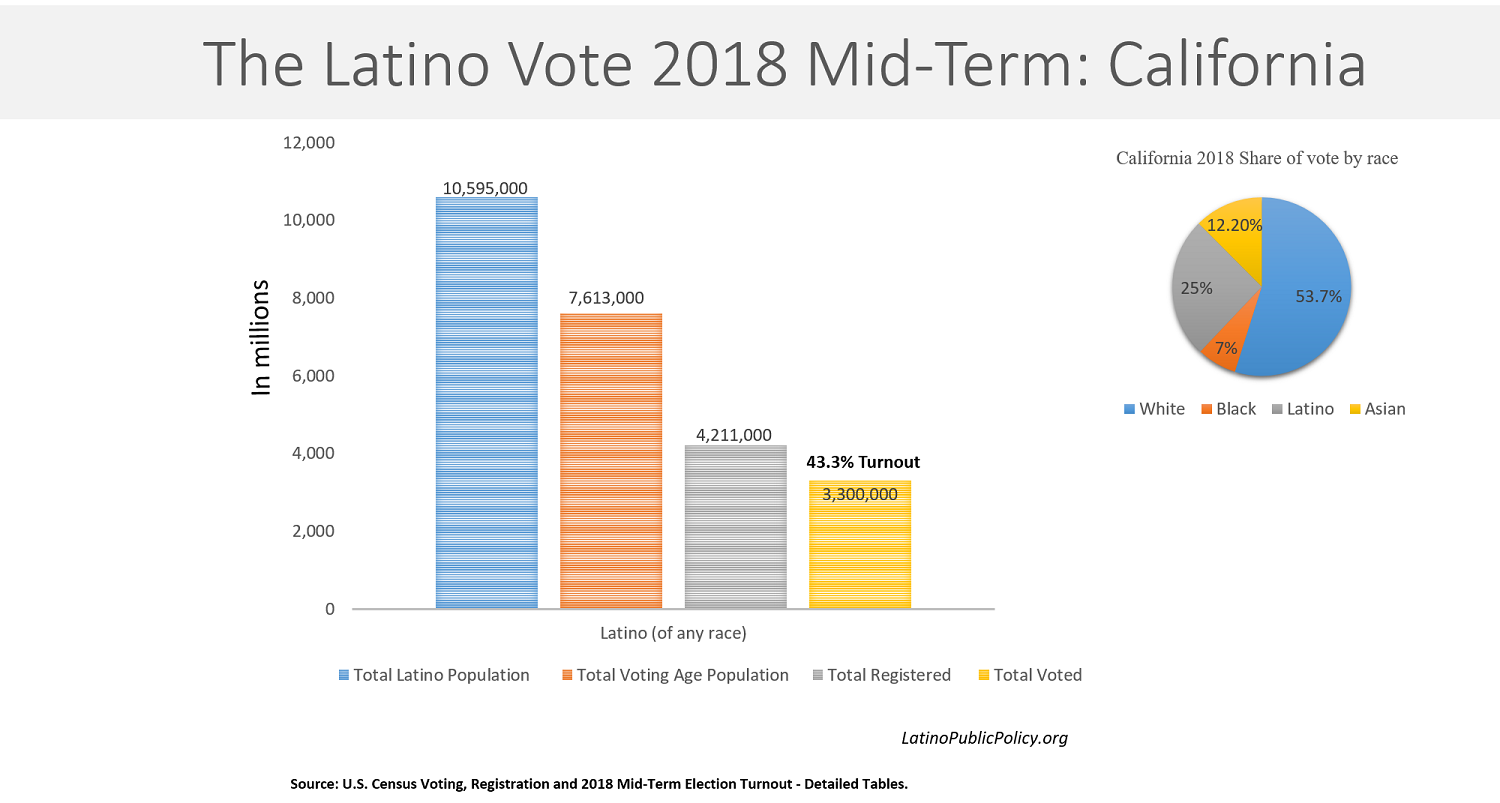
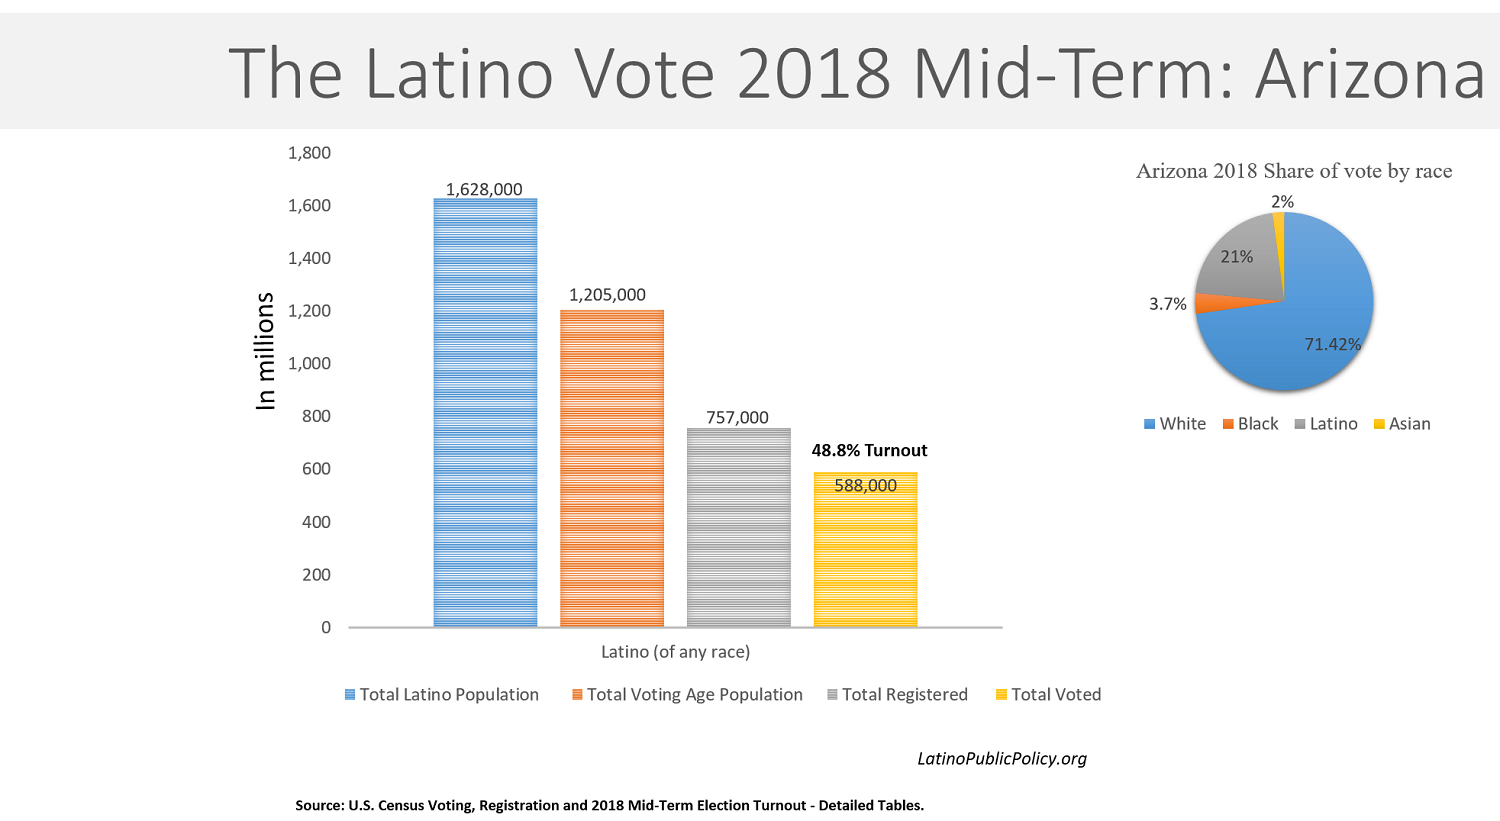
The U.S. Census data shows that there was an overall 40% of the Latino Vote nationally; 11.6 million Latinos cast ballots in 2018, up from 6.8 million in 2014, the percentage of Latino adult citizens who made their voices heard, but turnout varies by state. Results from the CPS data show that Latino voter turnout, though turnout was up to more than 40% in 2018 from 27% in 2014, Texas still had the lowest turnout among Latinos with only 35% while Arizona had the highest with 48%. Though California has the largest number of Latinos registered to vote with 4,211,000, California turnout was only 43%.
You can read the Pew Hispanic post-Election estimates based on exit polls here, but this is the actual data.
Texas – Click on image to enlarge
California – Click on image to enlarge
Arizona – Click on image to enlarge
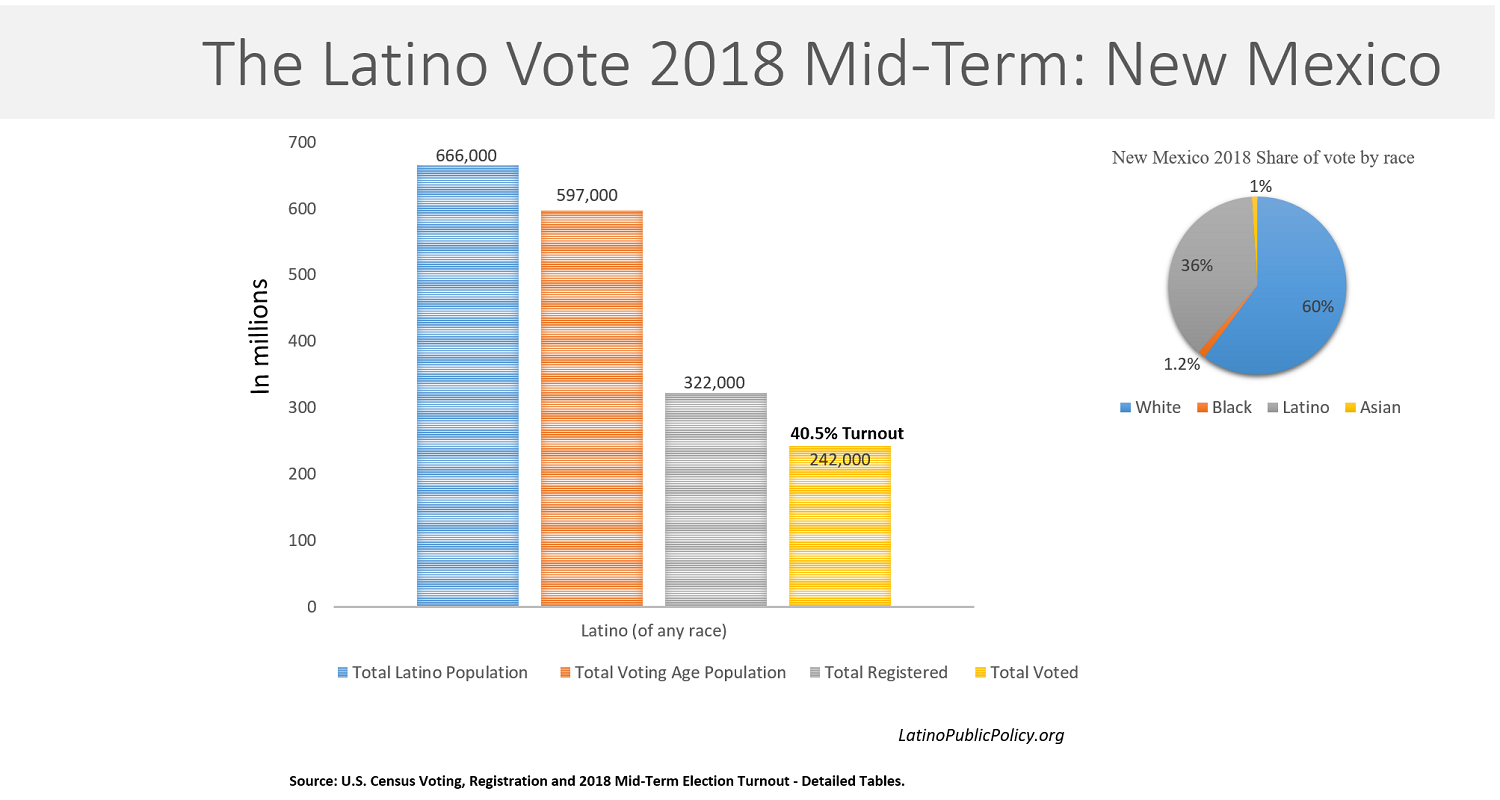
New Mexico – Click on image to enlarge
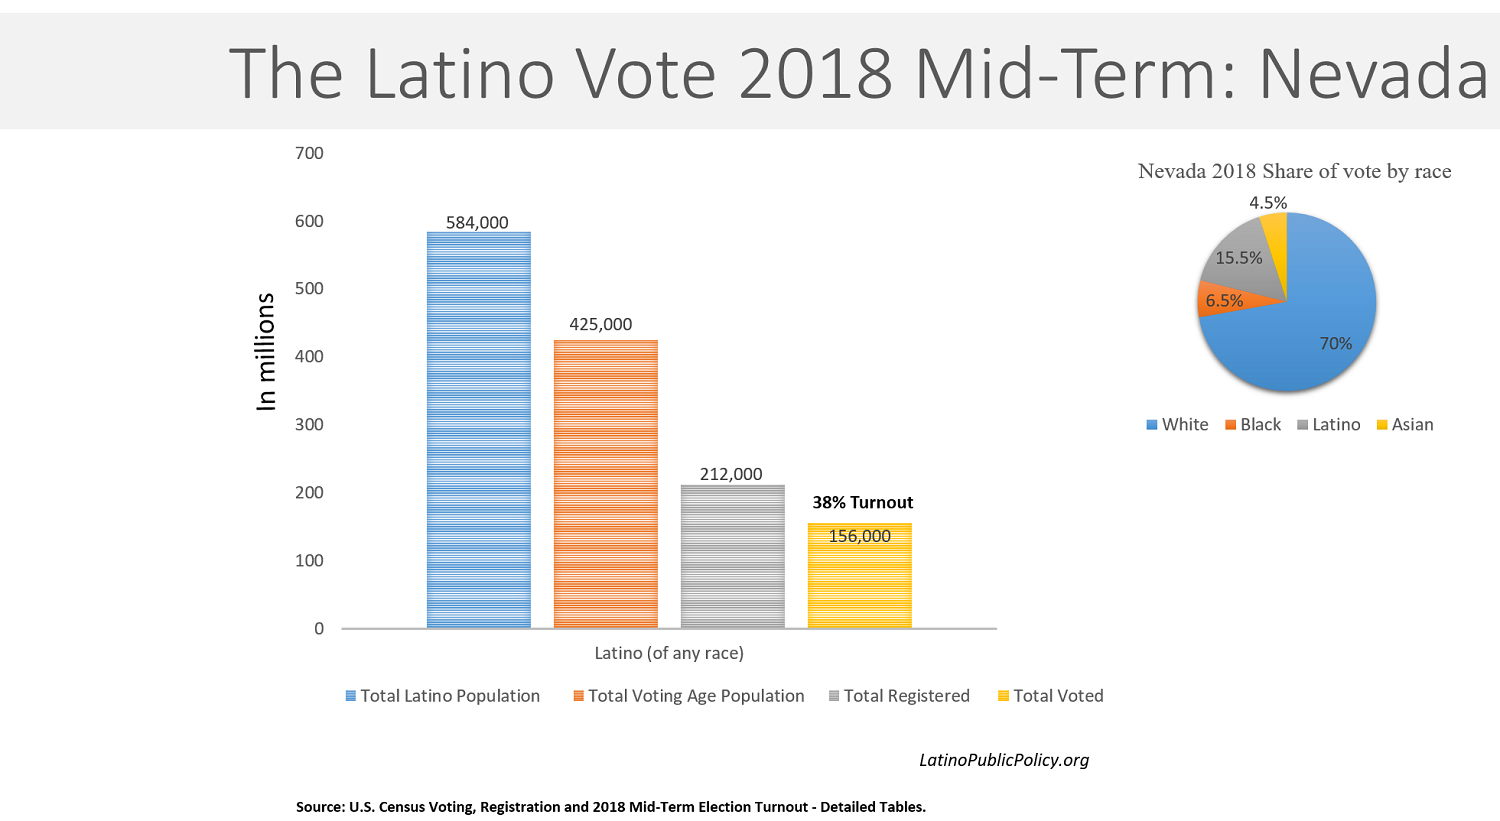
Nevada – Click on image to enlarge
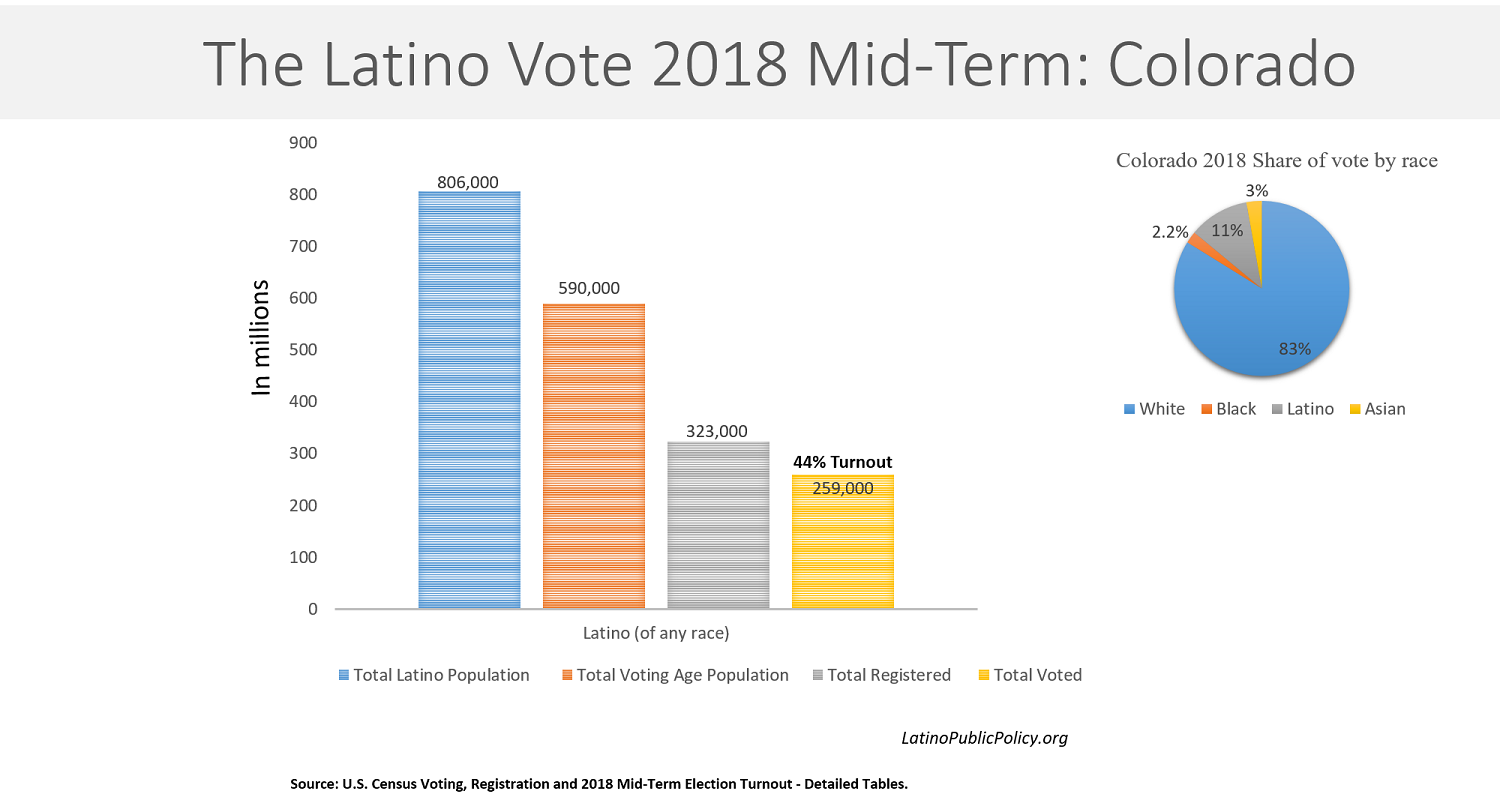
Colorado – Click on image to enlarge
Read The Latino Vote state-by-state 2016.
Alex Gonzalez is a political Analyst, Founder of Latino Public Policy Foundation (LPPF), and Political Director for Latinos Ready To Vote. Comments to [email protected] or @AlexGonzTXCA