by Admin
Introduction
In the aftermath of renewed attention and visibility to high school dropouts in the early 2000s, an increasing number of institutions began to partner to envision a “Civic Marshall Plan” with clear goals, an evidence-based plan of action to meet them, and accountability for results over two decades. The GradNation campaign was officially launched in 2010, committed to reaching a 90 percent high school graduation rate by the Class of 2020. After a little more than a decade of collectively working on the high school dropout challenge, extensive contributions of others in the field, and the hard work in schools, districts, and states to improve outcomes for students, substantial improvements have occurred, and we have learned a great deal about the nature of the challenge and what works to drive progress.
Troublingly, despite this progress, deep equity gaps remain, as Black, Hispanic, and low-income students continue to graduate high school at rates far behind their white and more affluent peers. In addition, English Learners, students with disabilities, and homeless students all have graduation rates below 70 percent.
Taken together, the statistics show that specific student groups are experiencing a very different kind of education than their peers. This year we continue to call out the disparities in high school graduation rates for specific student subgroups and for the low-performing schools many of them attend, which are disproportionately affected by poverty, structural inequities, and inequitable access to resources, supports, and opportunities.
This is what the GradNation goal was built upon and why we remain committed to sharing this annual update, working together with our partners to raise graduation rates, insist on quality, and ensure better life outcomes for every young person in the country.
Part 1: High School Graduation Trends Across the Nation
In 2017, the national graduation rate reached an all-time high of 84.6 percent, up from 79 percent in 2011—when the four-year Adjusted Cohort Graduation Rate was first reported nationally—and a small increase from 84.1 percent in 2016. Although steady progress continues to be made, the nation remains off-pace to attaining the goal of a 90 percent graduation rate by 2020, which would require graduating an additional 199,466 students on time. What’s more, to achieve an equitable path to 90 percent, the majority of these additional students would need to be students of color, students with disabilities, and low-income students. Encouragingly, these student populations drove gains in high school graduation rates from 2011 through 2017. Graduation rates during this period climbed from 71 percent to 80 percent for Hispanic students, 67 percent to 77.8 percent for Black students, 70 percent to 78.3 percent for low-income students, and 59 percent to 67.1 percent for students with disabilities.
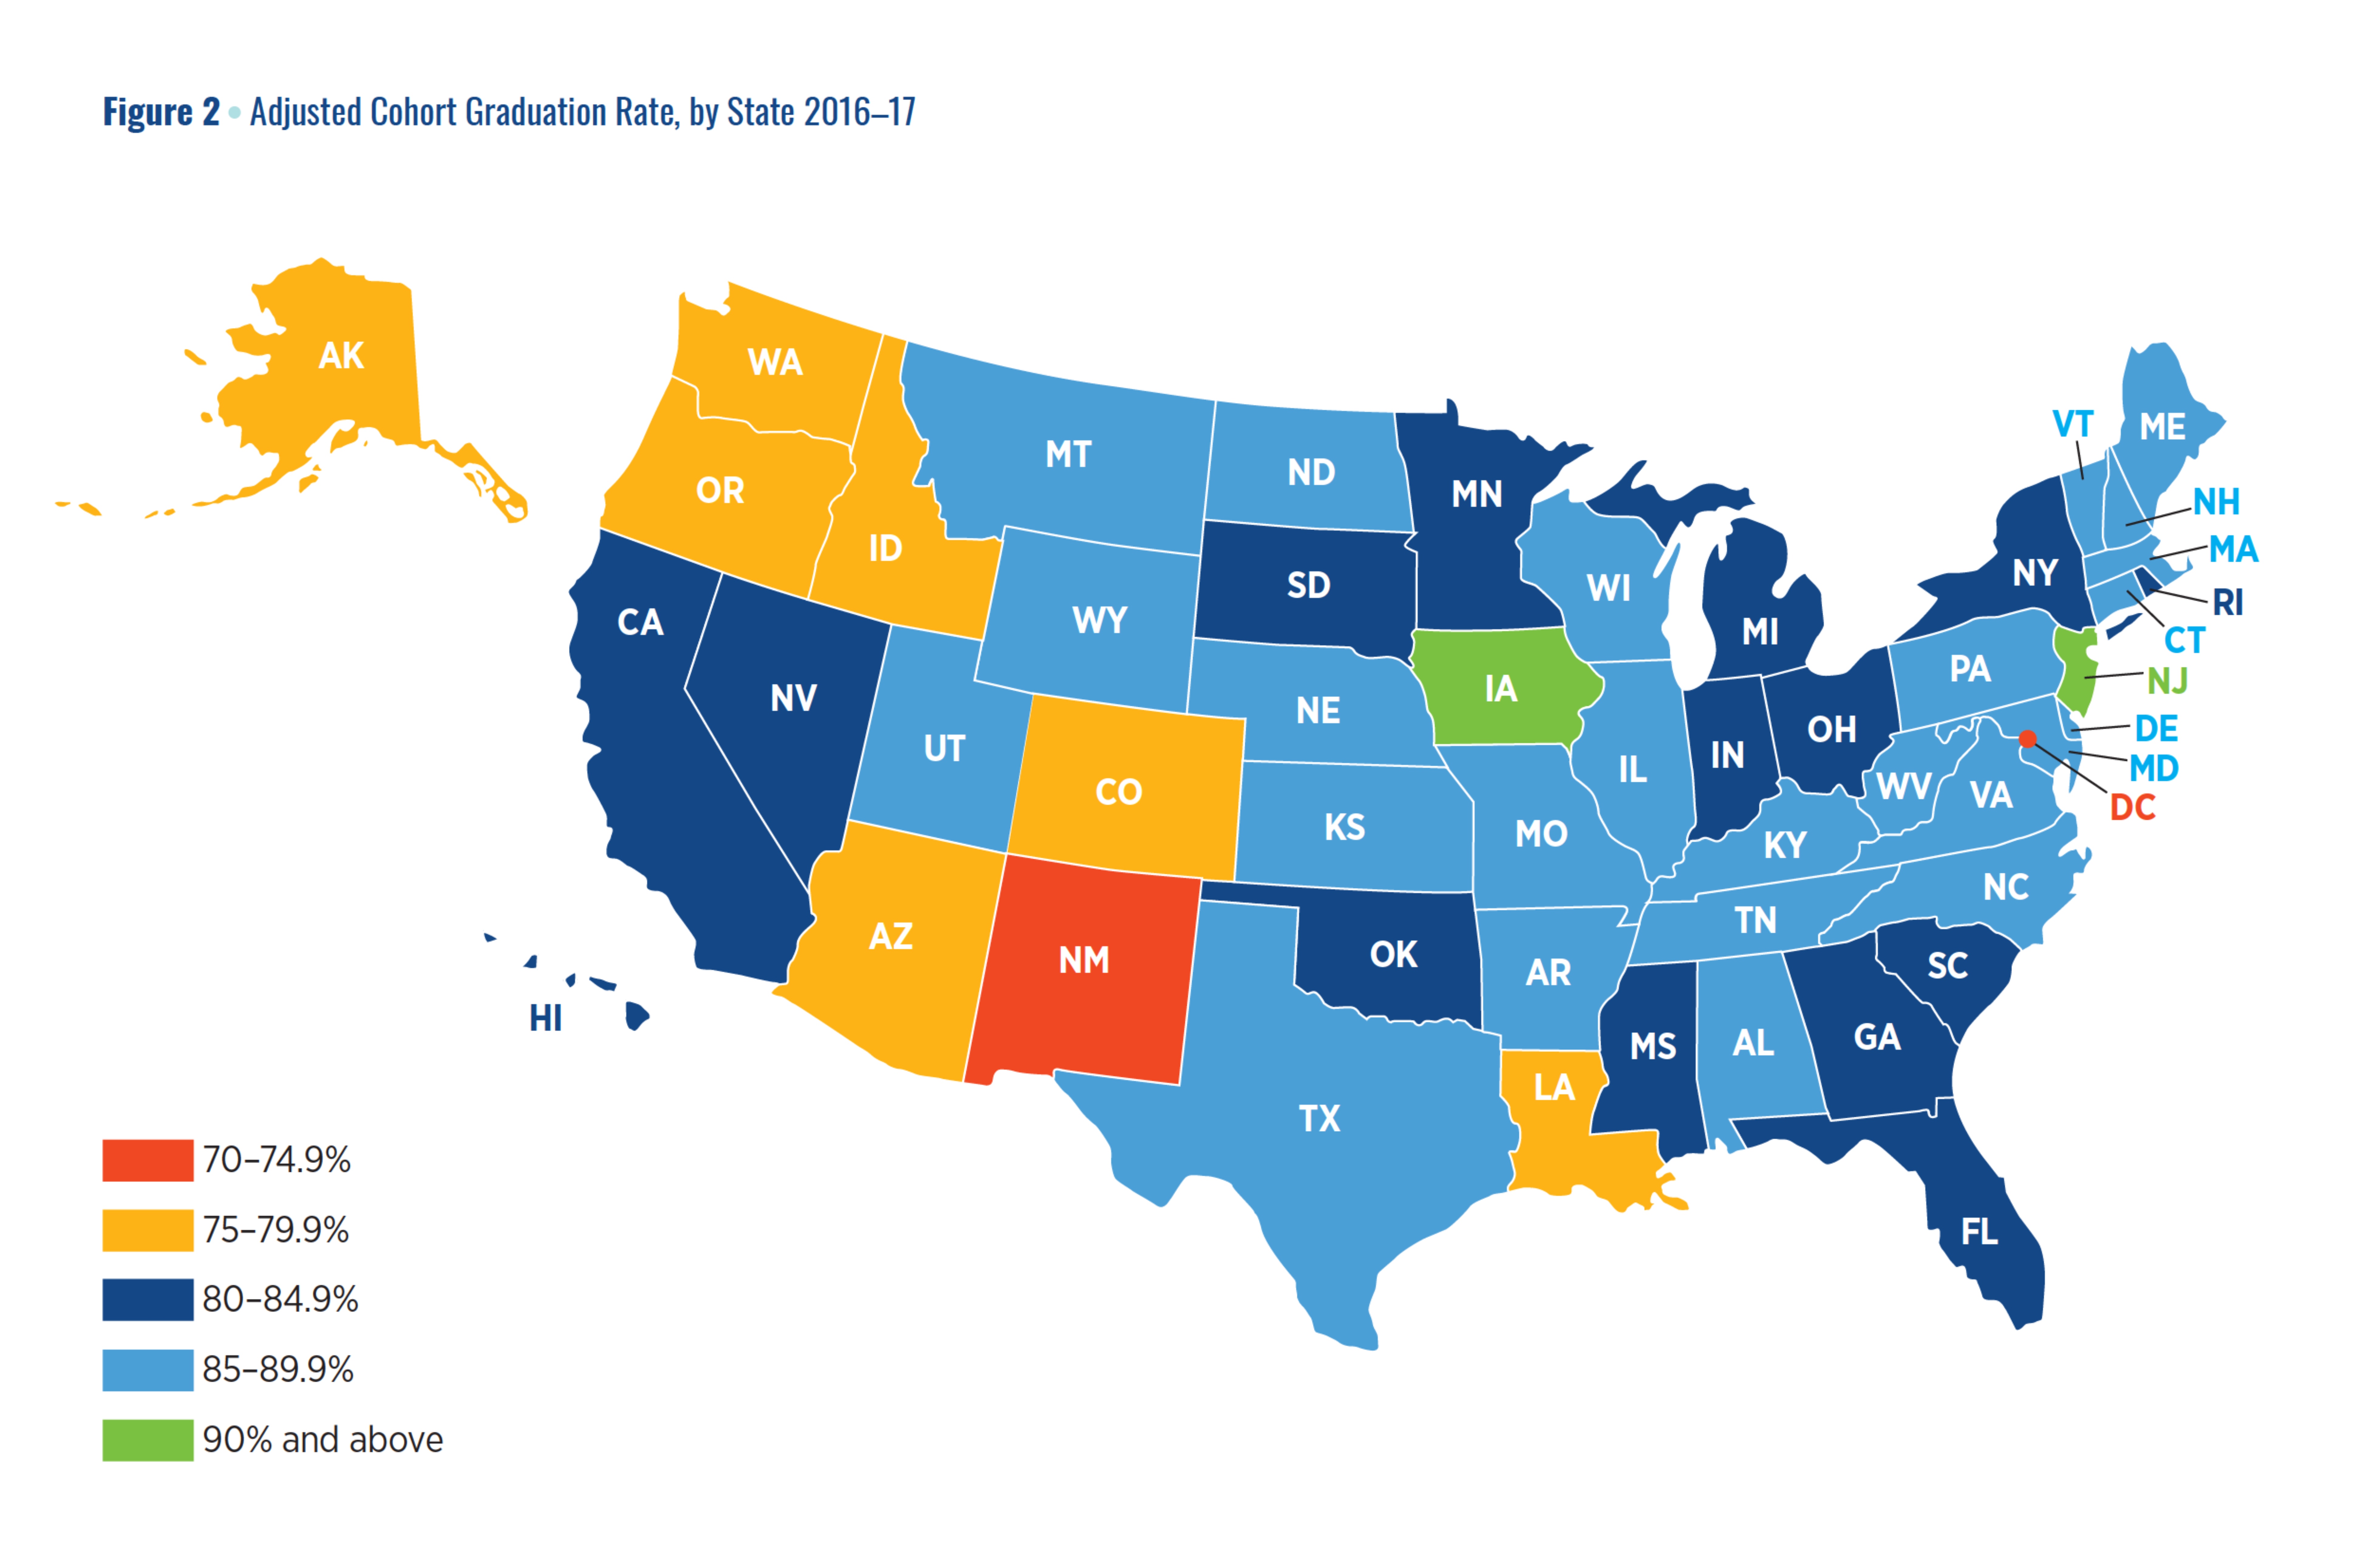
A review of state-level data shows that some states have already reached the national goal, other states have shown significant growth over time, and still others have failed to make sufficient progress or in some instances have even lost ground.
- The progress of high-poverty states like Georgia and West Virginia, which have seen their graduation rates increase by more than 10 percentage points since 2011, shows that, even in the face of challenges, boosting high school graduation rates is possible, even as other states struggle to do so.
- By 2017, two states (Iowa and New Jersey) remained at the national goal of 90 percent and 25 additional states had surpassed 85 percent, with New Mexico remaining the only state with a graduation rate below 75 percent.
- Six-year trend lines show 24 states making gains of 5 percentage points or more, seven of which made gains of more than 10 percentage points. Fifteen states made gains between 3 and 5 percentage points, nine made gains of less than 3 percentage points, and only two states have lost ground.
Part II: Reaching a 90 Percent Graduation Rate for All Students
Where We Stand
Low-Income Students: Low-income students made up 47.2 percent of the nation’s graduating cohort in 2017, with an average graduation rate of 78.3 percent. Improving graduation rates for this demographic is critically important to reaching the 2020 goal, given that they make up nearly half of the nation’s students. Only five states have low-income graduation rates above the national average for the overall student population of 84.6 percent (Arkansas, South Carolina, Texas, Kentucky, and West Virginia).
Black and Hispanic Students: Growth in the national graduation rate continues to be driven by increases for Black and Hispanic students across the country. Black and Hispanic students made higher yearly gains than their white counterparts (1.4 and 0.7 percentage points respectively, as compared to 0.3 percentage point for white students, and 0.5 percentage point nationally) in 2017. Despite a faster rate of growth, however, these subgroups of students still graduate at rates lower than their white peers.
In 2017, the national graduation rate for Hispanic students reached 80 percent for the first time, a milestone for the nation. Six states—Alabama, Arkansas, Maine, Texas, Vermont, and West Virginia—led the way with graduation rates greater than 85 percent. Twenty-six states had graduation rates below 80 percent for Hispanic students, two of which (Louisiana and Minnesota), had graduation rates below 70 percent. This is an improvement from 2016 when five states had rates below 70 percent for this subgroup.
Graduation rates for Black students also fall below the national average, with a rate of 77.8 percent. Among the five states with the largest percentage of Black students, only two (Maryland and Alabama) have obtained graduation rates for Black students that exceed the national average for the overall student population.
Homeless Students: This year, 44 states shared 2016–17 data voluntarily with the National Center for Homeless Education. While data specific to each state will not be released by NCHE this year, NCHE used the submitted state data to calculate a national average graduation rate of 64 percent for homeless students, as compared to the low-income rate of 78.3 percent, and 84.6 percent for all students. In addition, 26 states shared their graduation rate data for homeless students with our Education Leads Home campaign.
Students experiencing homelessness are 87 percent more likely to drop out of school than their housed peers, and without a high school diploma youth are 4.5 times more likely to experience homelessness later in life (Morton, Dworsky, and Samuels, 2017).
Students With Disabilities: Although state-to-state discrepancies make state comparisons challenging, one thing is clear – students with disabilities continue to graduate at rates well below their peers. The graduation rate for students with disabilities ticked up in 2016–17, increasing by 1.6 percentage points to 67.1 percent nationally, the largest uptick among subgroups analyzed in this report. This marks a six year increase of 8.1 percentage points. Although most states saw improvements in their on-time graduation rate for students with disabilities, just 26 states saw increases of at least 1 percentage point. Moreover, 14 states saw their rates decline over the past year.
English Learners: Discouragingly, as English Learners (ELs) increasingly make up a larger share of the population, in 2017 their graduation rate decreased nationally by 0.5 percentage point, dropping to 66.4 percent. This leaves ELs with the second-lowest graduation rate of any of their peers, other than initial estimates of graduation rates for homeless students. In total, 19 states saw their graduation rate decline while another two saw no change in their overall rate. In 15 states, less than 60 percent of EL students graduate on time.
Low-Graduation-Rate High Schools: In 2017, there were 2,357 low-graduation-rate high schools, down from 2,425 in 2016. These low-graduation-rate high schools accounted for 12.5 percent of all public high schools enrolling 100 or more students that reported ACGR in 2017, enroll about 6.5 percent of all students, and educate approximately 31 percent of all four-year non-graduates. Low-income students and students of color disproportionately attend low-graduation-rate high schools.
Under ESSA, states have identified 1,805 schools in need of comprehensive support and improvement (CSI, or CSI schools).
Part III: Examining the Connection Between High School, Postsecondary, and the Workforce
As high school graduation rates continue to rise, concerns have been expressed that some of the improvement may be driven by the lowering of standards and, in so doing, weakening the value of a high school diploma and its ability to signal college and workplace readiness. In order to dig more deeply into this question, we developed a state level index of secondary school improvement.
- The Secondary School Improvement (SSI) Index uses four measures – the percent of students scoring proficient on the 8th grade Reading and Math National Assessment of Educational Progress (NAEP) exams, the percent of students receiving a 3 or higher on an Advanced Placement (AP) exam, and the percent of students graduating from high school in four years – that, taken together, provide a measure ofthe extent to which states have been able to improve both graduation rates and academic outcomes.
- Sixty-eight percent of states have been able to improve both their graduation rates and at least two other measures of academic success of their secondary schools, while nearly one-third have not.
Analysis of recent data from the U.S. Census Bureau’s Current Population Survey show that, for the first time ever, immediate postsecondary enrollment rates for low-income students match those of their middle-income peers.
Analysis of a recent longitudinal study out of Boston show that three indicators – an attendance rate of 94 percent or higher during four years of high school, a GPA of 2.7 or higher, and completing the required set of courses for admission to state university systems and taking an AP class—were highly predictive of both earning and not earning a bachelor’s degree within seven years of high school graduation. In fact, the odds of achieving a four-year degree increase from 10 percent to 84 percent as the number of college success indicators a student meets moves from zero to three. Yet, these factors fail to predict success in two-year postsecondary programs.
Policy Recommendations
Continue to improve graduation rate data collection and reporting. While the Adjusted Cohort Graduation Rate remains the “gold standard” for collecting and reporting on high school graduation rates in its seventh year, there is still room for improvements that would guarantee the best data is available.
Probe deeper on credit recovery programs. While credit recovery courses have long been in existence to help students failing core coursework to graduate, the advent of computer technology has allowed credit recovery courses to help more students earn their diploma in a timely manner.
Promote greater alignment and clarity on how students with disabilities are treated across states. Research has indicated that anywhere from 24 to 32 states offer diploma options specifically for students with disabilities. Moreover, there is an increasing trend in the number of states providing diploma options exclusively for youth with disabilities (Achieve, 2016; Johnson, Thurlow, Qian, & Anderson, 2019).
Promote policies that reduce damaging academic disparities. The data show that Black, Hispanic, and low-income students are less likely to be on track to graduate on time and persist on to postsecondary college and career ready.
Align diplomas with college- and career-ready standards. Two recent reports on the quality of high school diplomas found mismatches between high school graduation requirements and state college admissions criteria, as well as the number and types of students earning college- and career-ready diplomas in the few states that offer them (Almond, 2017; Jimenez and Sargrad, 2018).
Create state-specific high school graduation plans. States should develop “Closing the Grad Gap on the Path to 90 Plans” that analyze which districts, schools, and students within their states need additional supports or guidance.
Improve data collection and reporting on postsecondary transitions and outcomes. In order to properly understand the full nature of postsecondary enrollment and success, states must improve postsecondary data collection and reporting.
Strengthen the transition from high school to postsecondary and careers. There are clear steps K–12 education leaders can take to ease the transition from high school to postsecondary and careers.
America’s Promise Alliance is non-profit based in D.C.