

by Peterson Foundation
In its annual report on income and poverty, the U.S. Census Bureau publishes data on national economic measures such as household income, earnings, wealth, employment, and poverty. Among the findings in the report was that in 2018, for the first time in 11 years, the official poverty rate was significantly lower than it was in 2007, when the Great Recession began. The report highlighted other notable trends, including:
- From 2017 to 2018, the poverty rate decreased by 0.5 percentage points from 12.3 percent to 11.8 percent. The population in poverty decreased by 1.4 million people during that period.
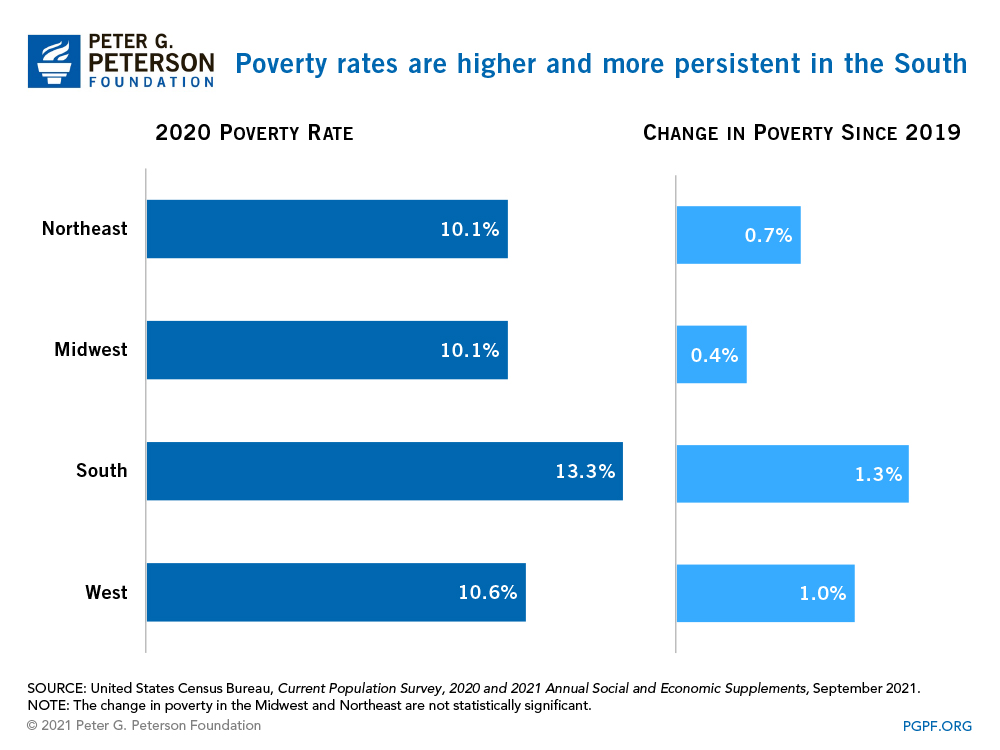
- The poverty rate in the South remained at 13.6 percent; it was the only region in which poverty didn’t decline.
- Median family income was $63,179 in 2018, which was not significantly different than in 2017.
Those statistics mask important variations in income and poverty both across time and across gender, age, and race. The charts below — which use the Official Poverty Measure rather than alternatives such as the Supplemental Poverty Measure — can provide insight into longer-term trends in income and poverty, as well as some nuance to national statistics.
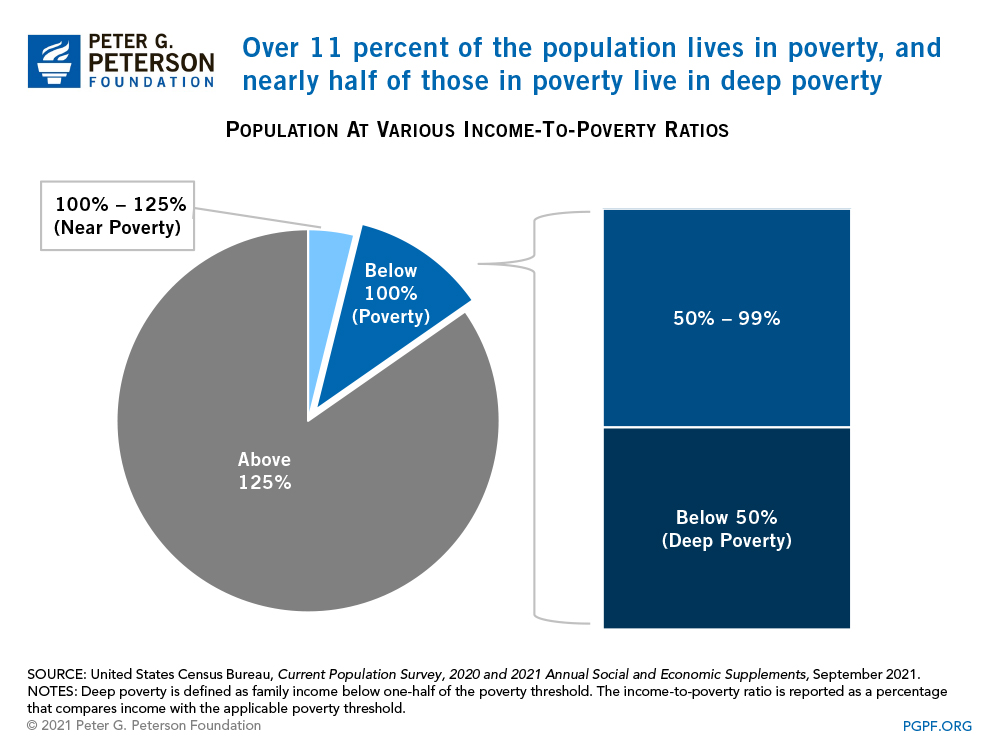
More than 38 million people remained in poverty in 2018. The income-to-poverty ratio helps to better understand how many people live near poverty, as well as the depths of poverty, in this country. For example, in 2018, 17.3 million people — which represents 45.3 percent of all people in poverty — earned less than half of their poverty threshold, also known as deep poverty. Meanwhile, 13.6 million people lived just above the poverty line.
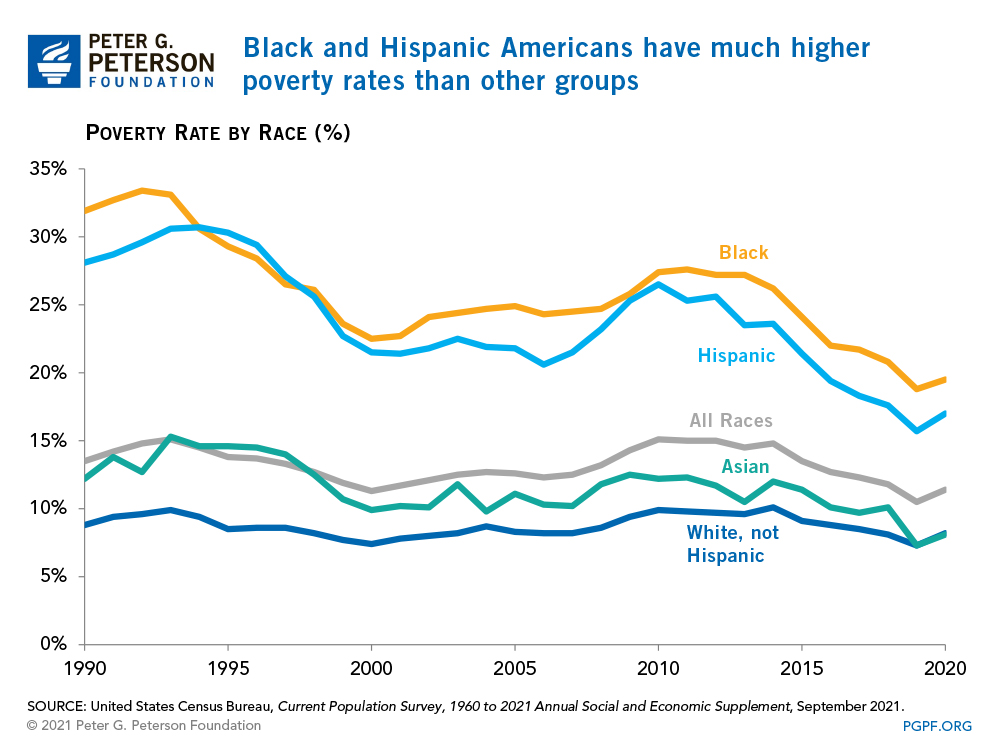
While the overall poverty rate has dropped slightly over the past 30 years, poverty rates for Blacks and Hispanics have decreased more noticeably. Nevertheless, they remain well above the average; in 2018, the poverty rate for Blacks was 20.8 percent and the rate for Hispanics was 17.6 percent.
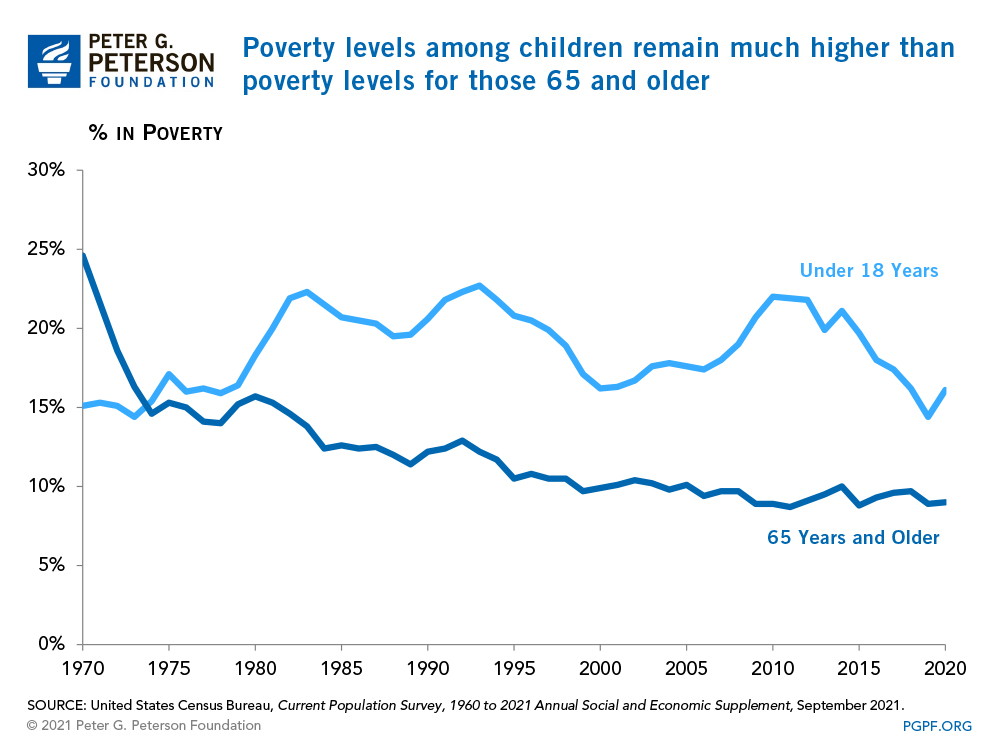
The poverty rates among children also remain high, despite having decreased somewhat in recent years. In 2018, 16.2 percent of children were in poverty. Poverty rates for the elderly are lower, meanwhile, thanks to Social Security. However, while 45 percent of the 2018 federal budget went towards health and retirement benefits for adults, only 9 percent was spent on children.
Poverty is unequally distributed by region. The Northeast and Midwest had the lowest percentage of people in poverty in 2018 and also saw the largest decrease in poverty between 2017 and 2018. The South, meanwhile, had the highest poverty rate, at 13.6 percent.
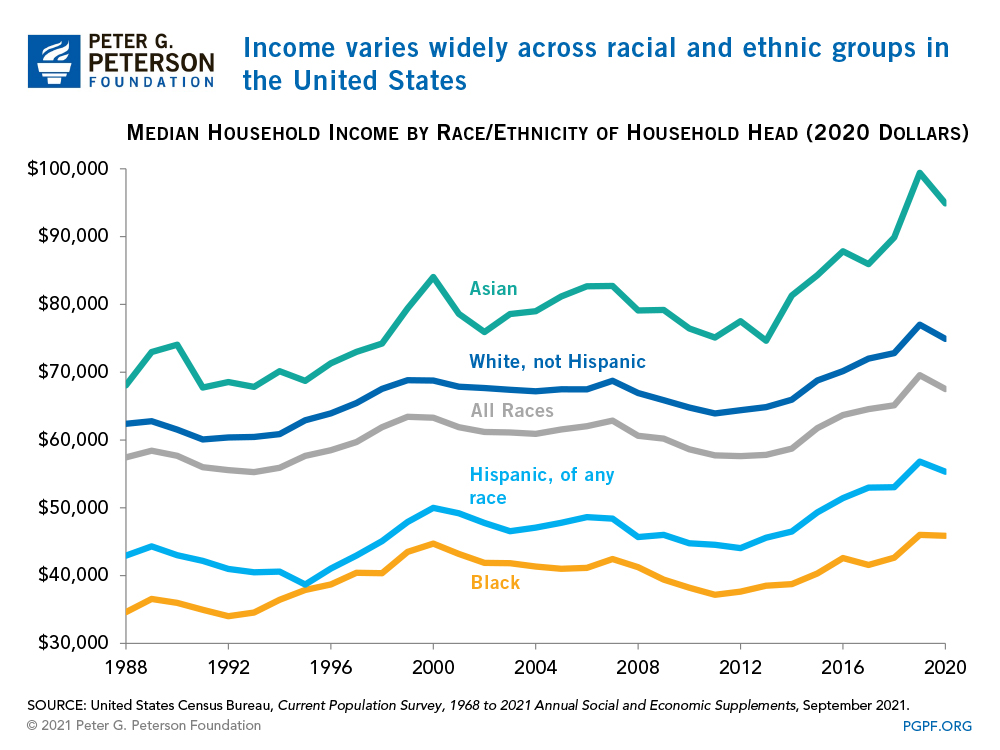
Changes in median family income have been uneven over the past 30 years and some groups have seen more growth than others. Median income ranged from $41,361 for Black household heads to $70,642 and $87,194 for White and Asian household heads, respectively.
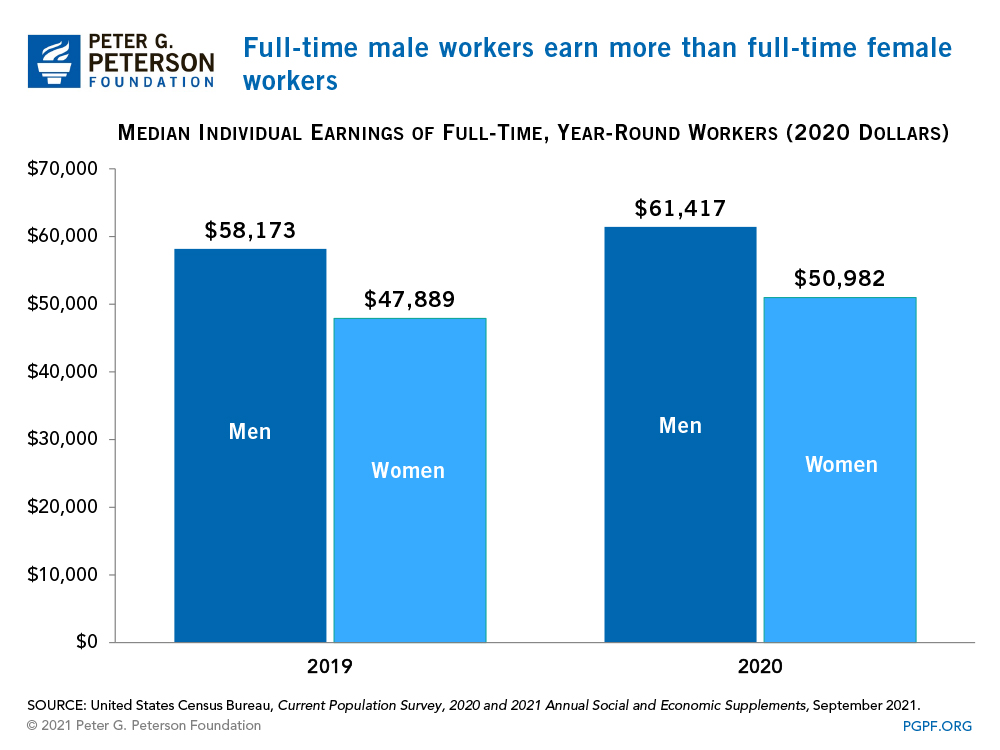
Median earnings for men and women increased by 3.4 percent for all workers between 2017 and 2018, but men continued to make more than women. In 2018, the female-to-male earnings ratio was 0.82 — largely unchanged from 2017.
Many of the trends reported by the 2018 Income and Poverty report are encouraging, but challenges remain both in measuring and addressing poverty as well as the slow growth in income in the United States. Addressing those issues would help create a more inclusive and robust economy.
.