by Robert Warren, Center for Migration Studies
Introduction
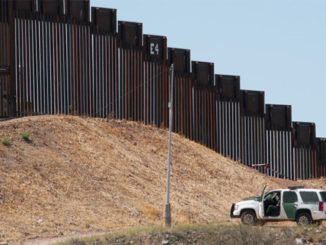
This report presents estimates of the US undocumented population for 2017 derived by the Center for Migration Studies of New York (CMS). It focuses on the steep decline in the undocumented population from Mexico since 2010. While the president has focused the nation’s attention on the border wall, half a million[1] US undocumented residents from Mexico left[2] the undocumented population in 2016 alone, more than three times the number that arrived that year, leading to an overall decrease of nearly 400,000 undocumented residents from Mexico from 2016 to 2017. From 2010 to 2017, the undocumented population from Mexico fell by a remarkable 1.3 million.
For the past 10 years, the primary mode of entry to the undocumented population has been to overstay temporary visas. This report provides estimates of the number of noncitizens who overstayed temporary visas and those who entered without inspection (EWIs) in 2016 by the top five countries of origin.
Summary of Findings
- The US undocumented population from Mexico fell by almost 400,000 in 2017.
- In 2017, for the first time, the population from Mexico constituted less than one half of the total undocumented population.
- Since 2010, the undocumented population from Mexico has declined by 1.3 million.
- In California, the undocumented population from Mexico has declined by 26 percent since 2010, falling from 2.0 to 1.5 million; it also dropped by 50 percent in Alabama, and by one third in Georgia, New York, and New Mexico.
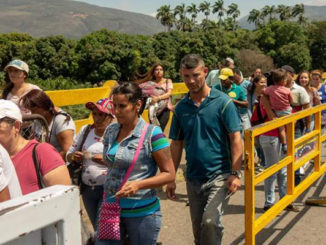
- The undocumented population from Venezuela grew rapidly after 2013, increasing from 60,000 to 145,000 in just four years.
- Visa overstays have significantly exceeded illegal border crossings during each of the last seven years.
- Mexico was the leading country for overstays in 2017, with about twice as many as India or China.
The estimates presented here were derived by CMS based on information collected in the Census Bureau’s annual American Community Survey (ACS). The procedures used to derive detailed estimates of the undocumented population are described in Warren (2014). CMS used its annual estimates of the undocumented population for 2010 to 2017 — by state of residence, country of origin, and year of entry — to compile the information described here. Additional methodological details appear as footnotes or as notes in the tables.
Undocumented Population Change since 2010
As shown in Figure 1, the total undocumented population declined by about one million from 2010 to 2017. The undocumented population from the rest of the world (not Mexico) increased by about 250,000 from 2010 to 2017. In Figure 1, the population increase for all other countries for 2017 is mostly the result of increases from India (100,000) and Venezuela (45,000). The right panel of Figure 1 reveals a historic precedent: In 2017, for the first time, the population from Mexico constituted less than one half of the total undocumented population.

The undocumented population from Mexico fell faster than the total population, dropping by 1.3 million during the period, spurred by more departures from this population than visa overstays or illegal entries (Figure 2).

The decline in the undocumented population from Mexico from 2010 to 2017 occurred nationwide. Table 1 shows 11 states that had 50,000 or more undocumented residents from Mexico in 2017 and had 20 percent or higher declines in the population from Mexico. The population in California fell by 26 percent, from 2.0 million in 2010 to 1.5 million in 2017. The population in Alabama (not shown) dropped by half, and the population in Georgia, New York, and New Mexico by one third (Table 1).

Population Change, by Country, 2010 to 2017
Table 2 shows estimates of the overall undocumented population and the change from 2010 to 2017 for the top 15 countries in 2017. The population from India increased by 265,000, or 72 percent, from 2010 to 2017. The population from Venezuela more than doubled, from 65,000 in 2010 to 145,000 in 2017, with all of the growth occurring from 2014 to 2017. Countries with the largest population declines during this period (in addition to Mexico) were: Philippines (-70,000), Ecuador (-45,000), and Korea (-40,000) (Table 2).

Mode of Entry
Arriving by air and overstaying temporary visas has been the primary way of entering the US undocumented population over the entire seven-year period covered by this report. Table 3 shows estimates of undocumented arrivals in 2016 by country of origin and mode of entry for the top five countries of origin. Of the estimated 515,000 arrivals in 2016, a total of 320,000, or 62 percent, were overstays and 190,000, or 38 percent, were EWIs.
The estimates are based on CMS estimates of undocumented arrivals by year of entry for 2016 and 2017 by country of origin, and US Department of Homeland Security estimates of overstays for Mexico, Central American countries, and the Dominican Republic in 2017.[3]
Mexico was the leading country for overstays in 2016, about twice the number from India, China, and Venezuela (Table 3). Overstays accounted for approximately one third of all undocumented arrivals from Mexico in 2016.
The appearance of Venezuela as a leading country of overstays in Table 3 might be surprising. However, the undocumented population from Venezuela (almost all overstays) increased sharply after 2013, most likely because of the political and economic turmoil in that country (CMS 2017).

Discussion
The estimates shown here have important policy implications. The varied rates of change for many of the countries shown here — the sustained drop in the population from Mexico, the upsurge from Venezuela after 2013, the continuing increase from India even as the populations from other Asian sending countries declined — indicate that the United States needs a more nuanced and evidence-based response to undocumented migration.
The downward undocumented population trends for Nicaragua, Ecuador, Peru, Poland, and Korea demonstrate that undocumented migrants will return to their home countries, even some in difficult conditions. A serious commitment to improving conditions in the Northern Triangle states of Central America, Venezuela, and other countries could significantly reduce the US undocumented population.
Since more than one half of all US undocumented residents arrive by air, visa-issuing posts have become the real frontline deterrent to undocumented migration. This report suggests that more attention and resources should be given to that crucial mission of the US Department of State. The sudden increase in the undocumented population (that is, overstays) from Venezuela after 2013 illustrates this point. In addition, Congress and the administration should pursue legislation to legalize populations like the DREAM-Act eligible, long-term beneficiaries of Temporary Protected Status (TPS), and “intending immigrants” with a recognized relationship with a US citizen or lawful permanent resident that would qualify them for a family-based visa (Kerwin, Alulema, and Nicholson 2018).
The disparity between current public discourse and the empirical data presented here obscures the fact that tremendous progress has been made in reducing undocumented immigration since 2000. It is time to build on that success by constructing an immigration reform package that upholds the rule of law while embracing the values that have truly made America great.
[1] In 2016, the US undocumented population from Mexico that arrived before 2016 was 5.6 million; one year later, in 2017, the number that arrived before 2016 had dropped to 5.1 million, indicating that half a million had left the undocumented population from Mexico.
[2] Undocumented residents leave the population by being removed, emigrating voluntarily, adjusting to permanent legal status, or dying.
[3] The percentage of undocumented to total arrivals for Mexico (34.7 percent), El Salvador (11.0 percent), Guatemala (24.9 percent), Honduras (20.4 percent), Nicaragua (56.3 percent), and Dominican Republic (54.4 percent) are from Table A-1 of Warren (2017). Estimation of overstays is also discussed in Warren and Kerwin (2017).
REFERENCES
CMS (Center for Migration Studies). 2017. “Venezuela in Crisis: the Plight of Venezuelan Refugees.” New York: CMS. http://cmsny.org/venezuela-in-crisis/.
Kerwin, Donald, Daniela Alulema, and Mike Nicholson. 2018. “Communities in Crisis: Interior Removals and their Human Consequences.” Journal on Migration and Human Security 6(4): 225-41. https://doi.org/10.1177/2331502418820066.
Warren, Robert. 2014. “Democratizing Data about Unauthorized Residents in the United States: Estimates and Public-use Data, 2010 to 2013.” Journal on Migration and Human Security 2(4): 305-28. https://doi.org/10.1177/233150241400200403.
———. 2017. “DHS Overestimates Visa Overstays for 2016; Overstay Population Growth Near Zero During the Year.” Journal on Migration and Human Security 5(4): 768-79. https://doi.org/10.1177/233150241700500403.
Warren, Robert, and Donald Kerwin. 2017. “The 2,000 Mile Wall in Search of a Purpose: Since 2007 Visa Overstays have Outnumbered Undocumented Border Crossers by a Half Million.” Journal on Migration and Human Security 5(1): 124-36. https://doi.org/10.1177/233150241700500107.