U.S. Census: Voting and Registration in the Election of November 2020 Tables
by Alex Gonzalez
See The Latino Vote 2016: state by state
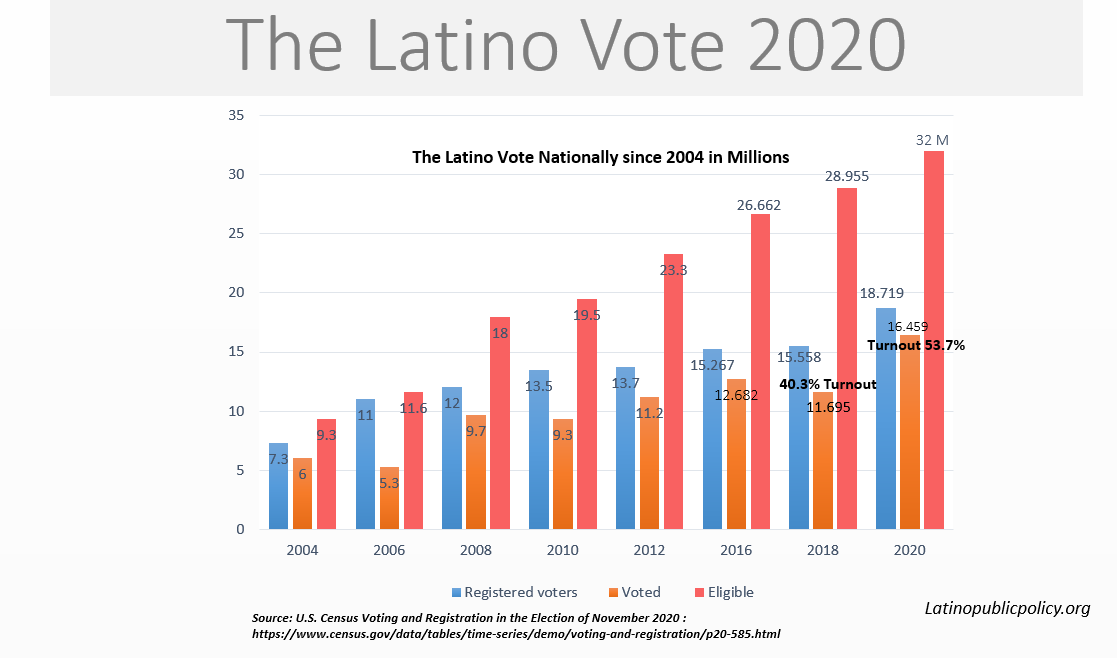
On Thursday, the U.S. Census released the Voting and Registration data of the 2020 Presidential Election than included turnout among Latino/Hispanic voters nationally and state by state. These are 9 charts showing the turnout numbers, as well as the share of the total Latino Vote in each state, in all major Hispanic states in the Southwest and Florida.
Many things stand out, but to fully understand where the Latino voter turnout increased and decreased from 2016, it’s crucial to look at the 2016 turnout (see link above).
Nationally, the Latino Vote increased to 16, 459,000 (53.7% turnout) from only 11,695,000 in 2016 (40.3% turnout). However, the increase in turnout nationally varies across states since some states saw a decrease in turnout among Latino voters while other saw a big increase. See chart below:
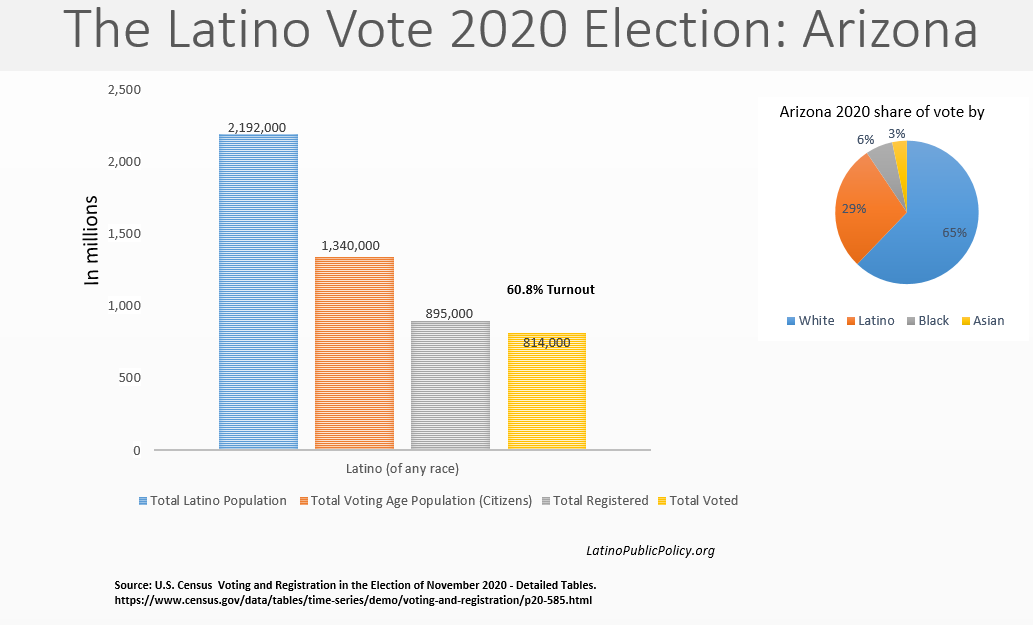
Arizona: Arizona saw the largest increase in turnout among Latino voters reaching a whopping 60.8%, up from 47.4% in 2016.
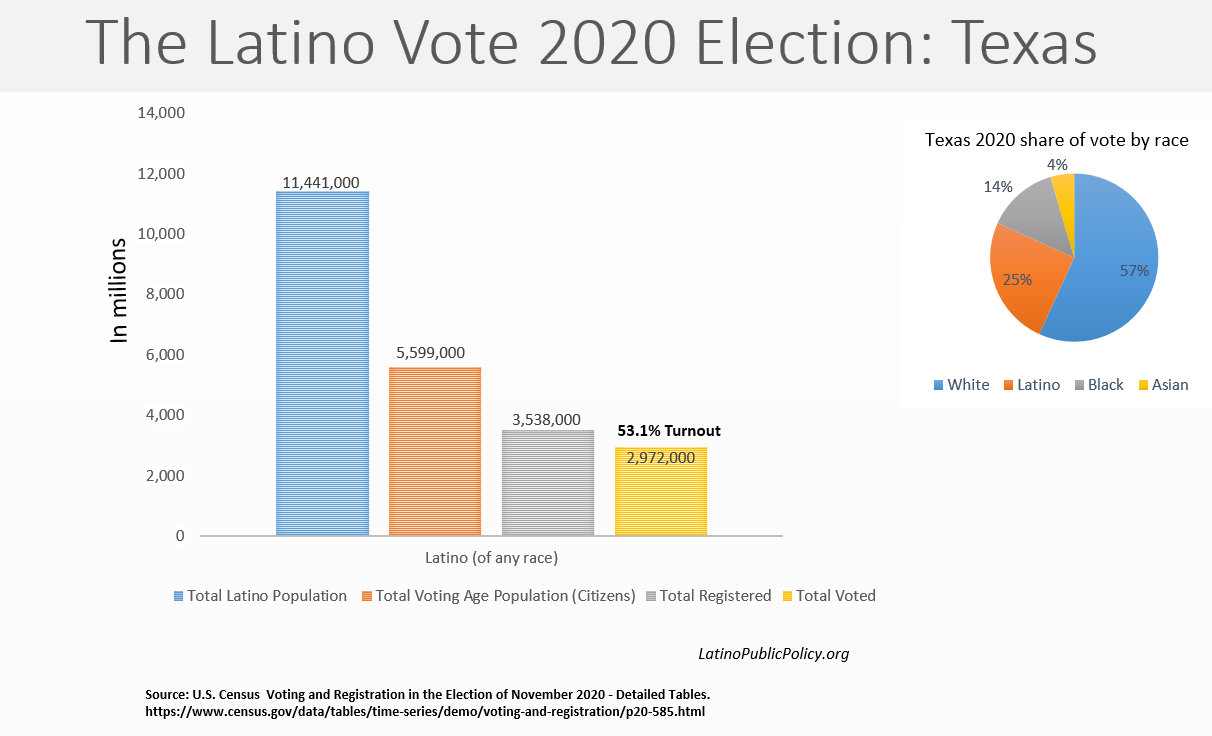
Texas: In 2016, turnout among Latinos in Texas was only 40.5% (1, 938, 000) barely on increase of 40,000 votes from 2012. However, in 2020, turnout increased to 2,972,000 million (53.1%). That was an increase of 1,038,000 from 2016. See 2016 turnout tables
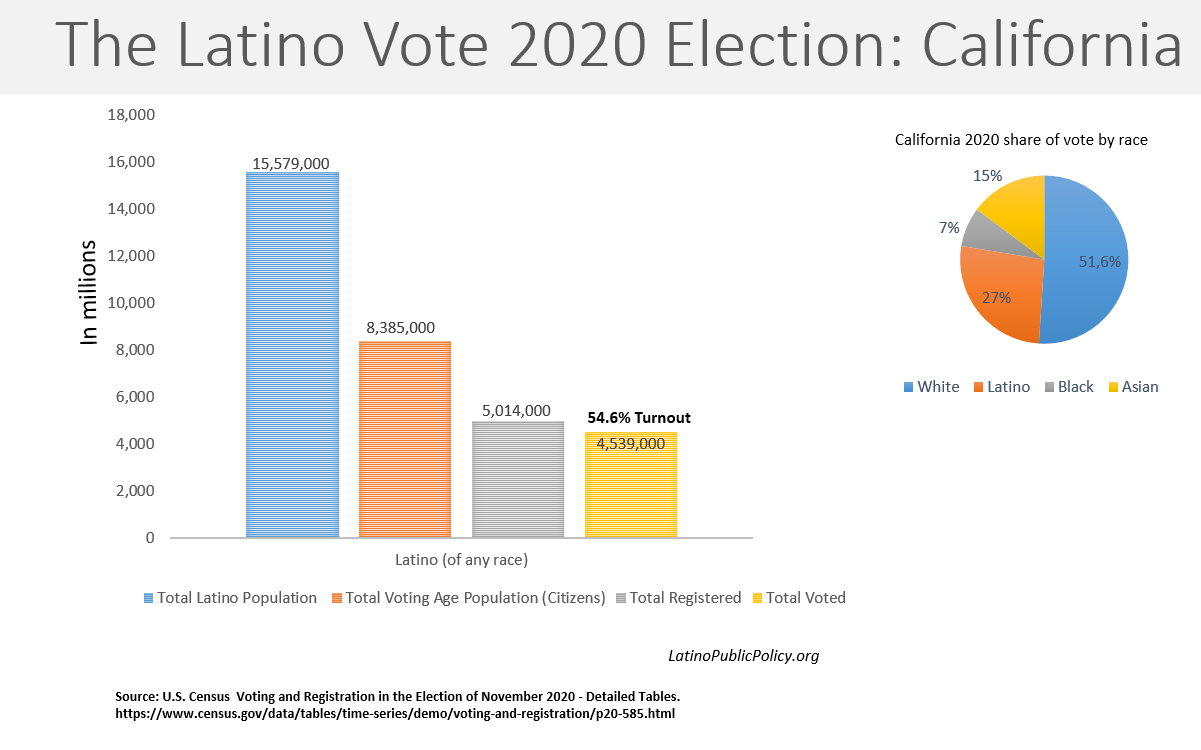
California: California also saw an increase in turnout among Latinos from 2016. In 2016, turnout among Latinos was 47.2%, but in 2020 it increased to 54.6%. Latino Vote in CA Increased by 1,196,000 from 2016.
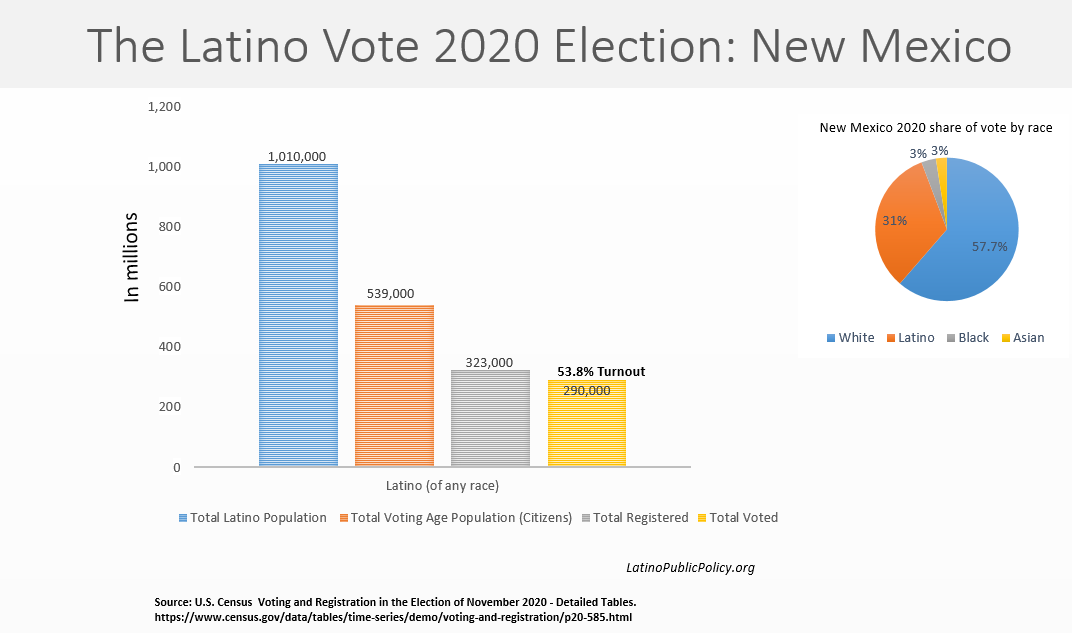
New Mexico: New Mexico turnout also increased from 48.2% in 2016 to 53.8% in 2020. Bur New Mexico increase in Latino Vote was only by 14,000 votes; it increased to 290,000 in 2020 from 276,000 in 2016.
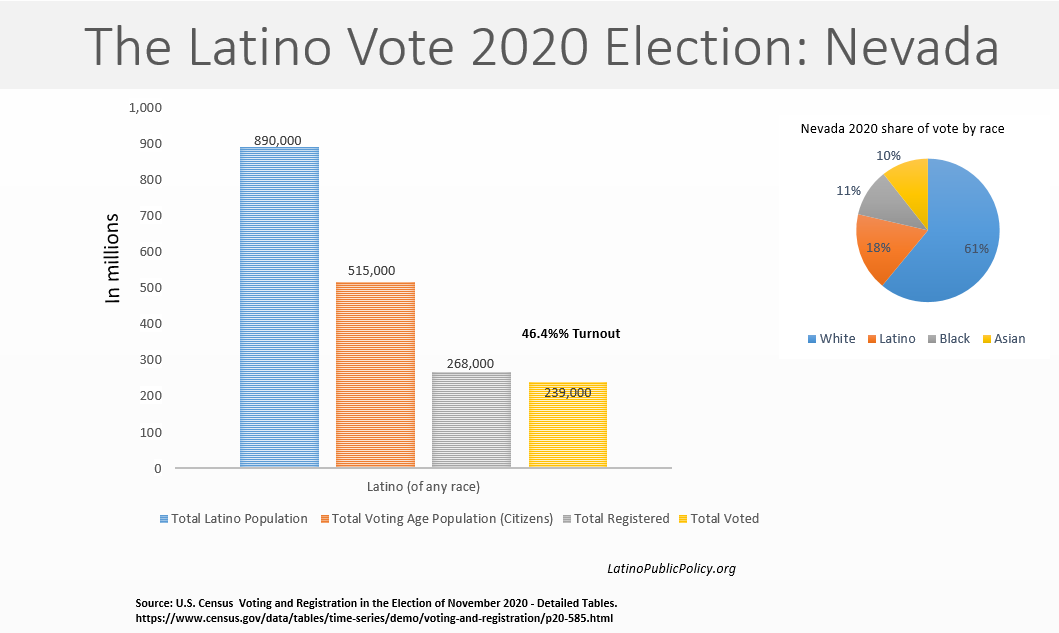
Nevada: Nevada was one the three states where Latino turnout dropped; it felt by 8%. Turnout among Latinos in Nevada was only 46.4%, down from 56.6% in 2016. While the population of Latinos eligible to vote in Nevada did increase to 346,000 in 2016 to 515,000 in 2020, turnout does not show reflect the overall exponential growth that occurred since 2016.
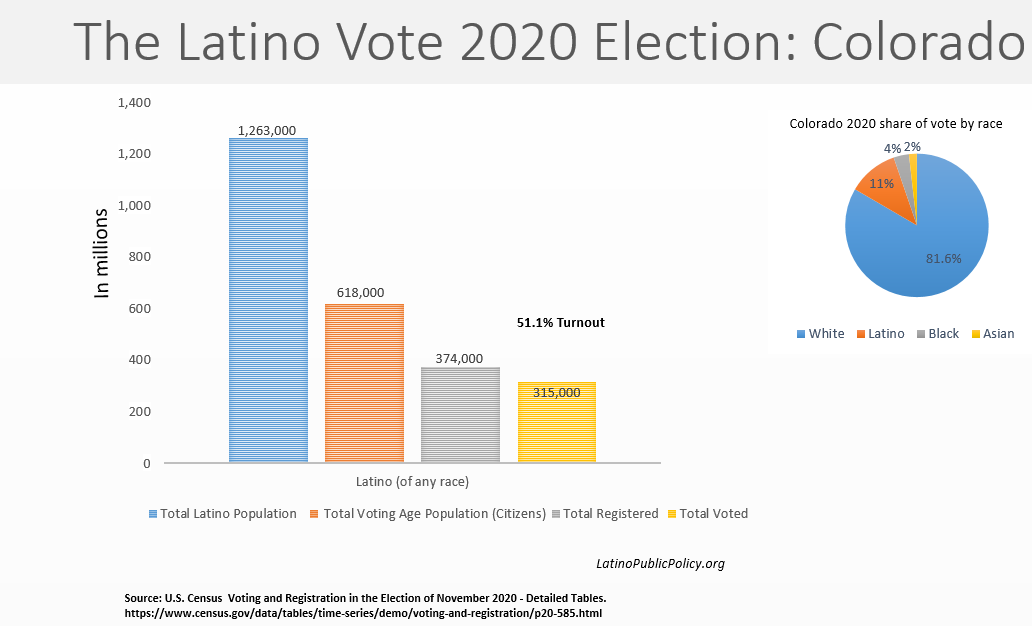
Colorado: Colorado, like Nevada, had one of the highest Latino turnout in the country. But, in 2020, turnout among Latinos voters felt to 51.1% from 56.6% in 2016.
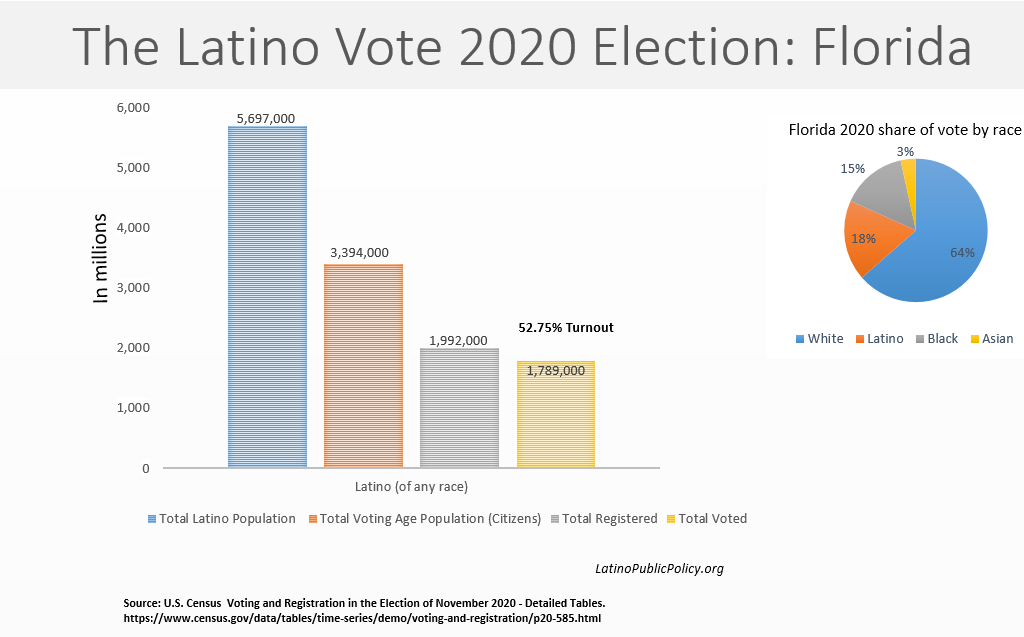
Florida: Like Nevada, Florida did increase Latino turnout by 200,000, turnout also felt to only 52.7% from 54.1% in 2016 and 62% in 2012 (see 2016 tables). This changes in turnout could be driven by the new different groups of Latinos settling in Florida who are not as motivated as the old bloc of Cuban voters who tended to vote in every election.
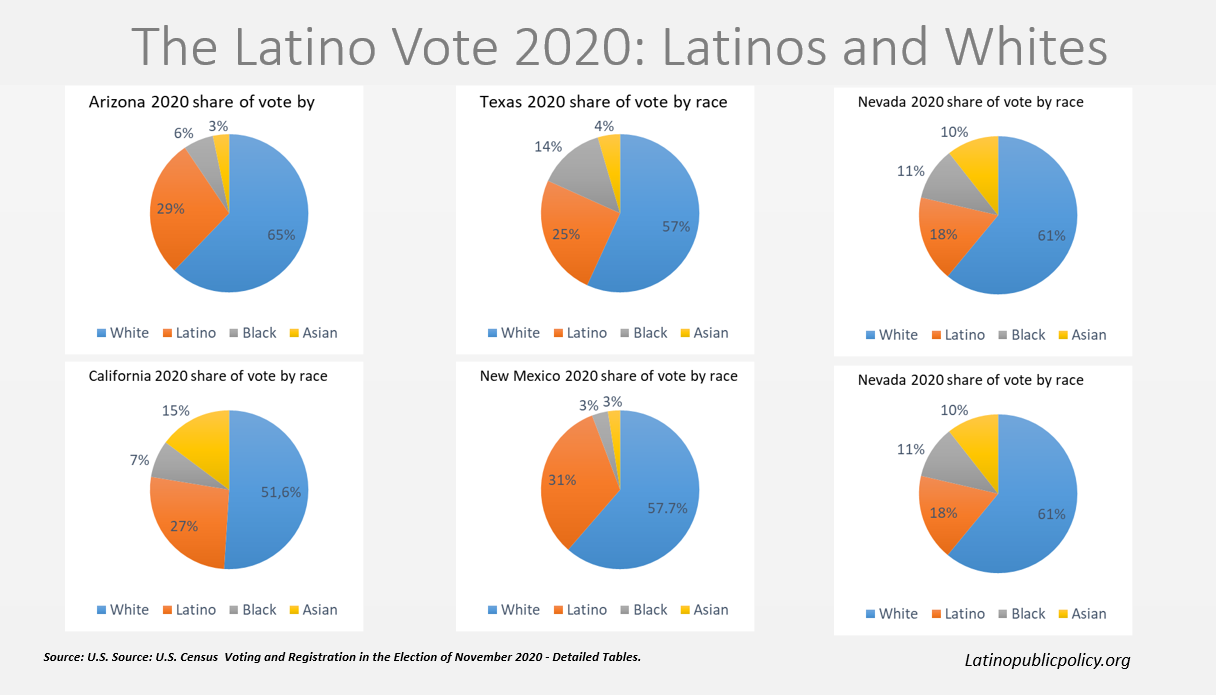
Latinos as share of the Vote by state:
2020 Exit Polls: The Exit Polls are very unreliable for many reasons. But, here they are nonetheless.
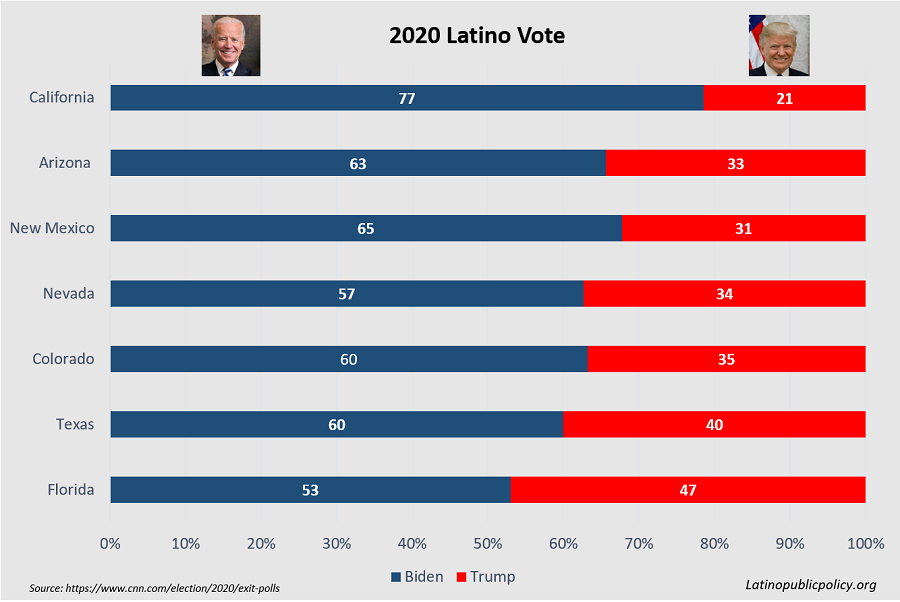
These are just the numbers, and interpreting the numbers in political circles who want to woo Latino Voters surly will come to different conclusions about what worked and what did to appeal to 32 million of Latinos eligible to vote in 2020.
.
Alex Gonzalez is a political Analyst, Founder of Latino Public Policy Foundation (LPPF), and Political Director for Latinos Ready To Vote. Comments to vote@latinosreadytovote.com or @AlexGonzTXCA