How grade inflation is boosting college graduation rates.
by Jeffrey T. Denning, Eric R. Eide, Richard W. Patterson, Kevin J. Mumford and Merrill Warnick
College admissions easily capture the public’s interest, and rising rates of high-school graduation and postsecondary enrollment are typically met with applause. But what matters most is whether students who go to college actually get a degree. And at least one third of all U.S. students don’t, even six years after they enroll.
This “college completion crisis” has inspired a range of responses, including President Biden’s proposed $6.2 billion Completion Grant Program currently before Congress. But what is the exact nature of completion challenge? Earlier research focusing on trends through 1990 found broad declines in college graduation rates, especially among men attending less-selective four-year schools. Since then, however, the picture of college enrollment has changed dramatically, with increases in both high-school graduation and college matriculation rates. Have completion rates changed as well?
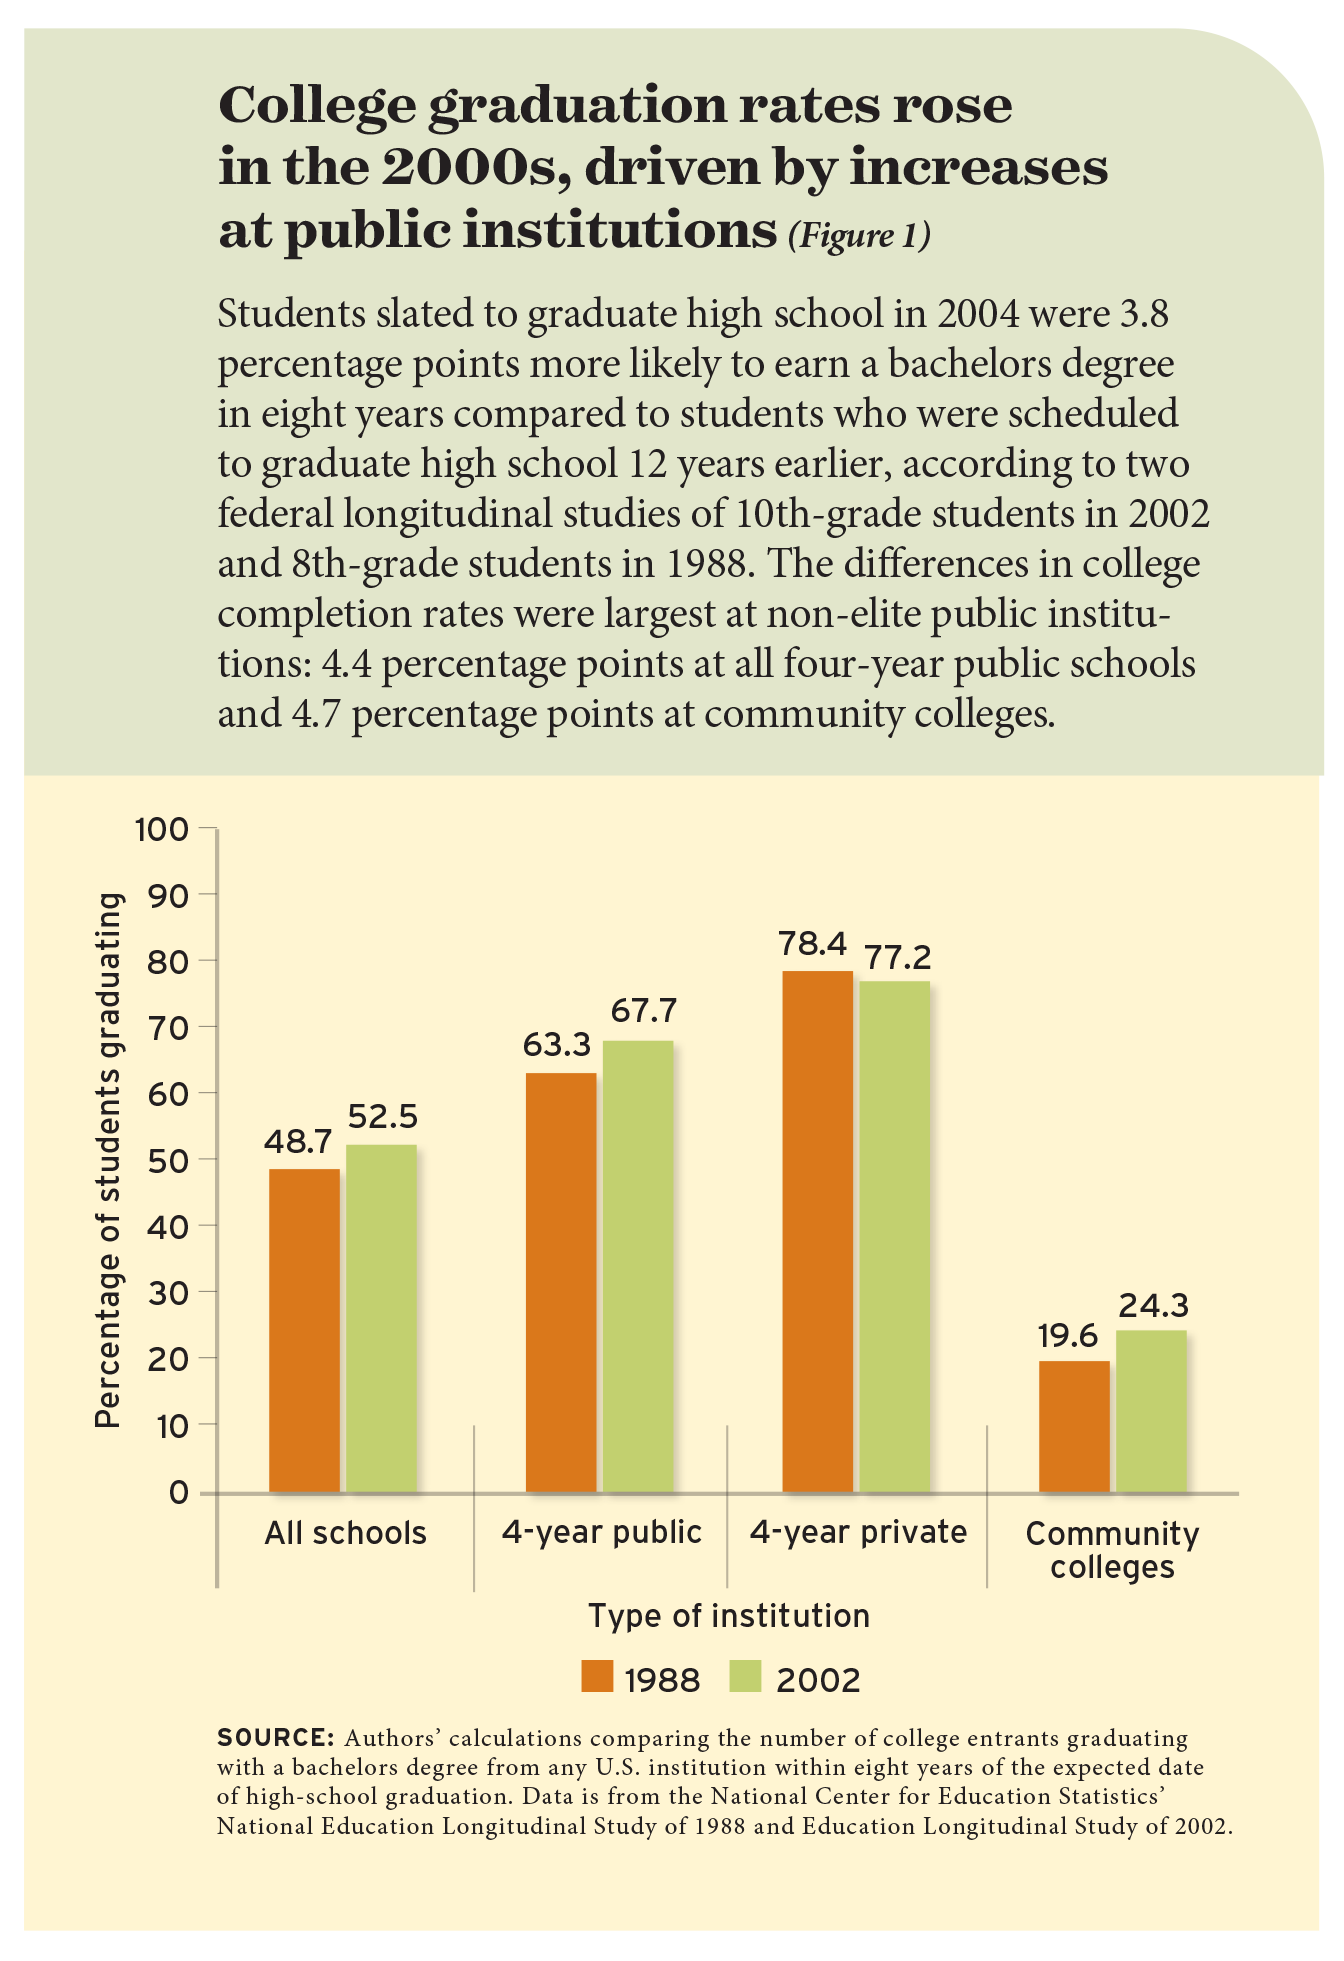
To find out, we analyze federal education and Census data and find that rates of college completion have gone up since 1990, at a broad mix of institution types and among both men and women. In looking at two federal longitudinal studies, we find students who were slated to graduate high school in 2004 are 3.8 percentage points more likely to graduate college than students from the class of 1992. This trend is confirmed in federal data, the Census, and registrar data from 10 public universities.
What’s driving this growth? We look at student background and academic preparation, as well as institutional practices like support-service spending, and find that none of these potential factors explain the changes. But one trend is clear across all the datasets: compared to decades past, college students have been earning better grades in recent years, and better college grades are strongly associated with higher rates of graduation. We explore a range of factors that could influence student performance, such as high-school preparation and rates of labor-force participation in college, and find that these would predict students to be less likely to graduate, not more.
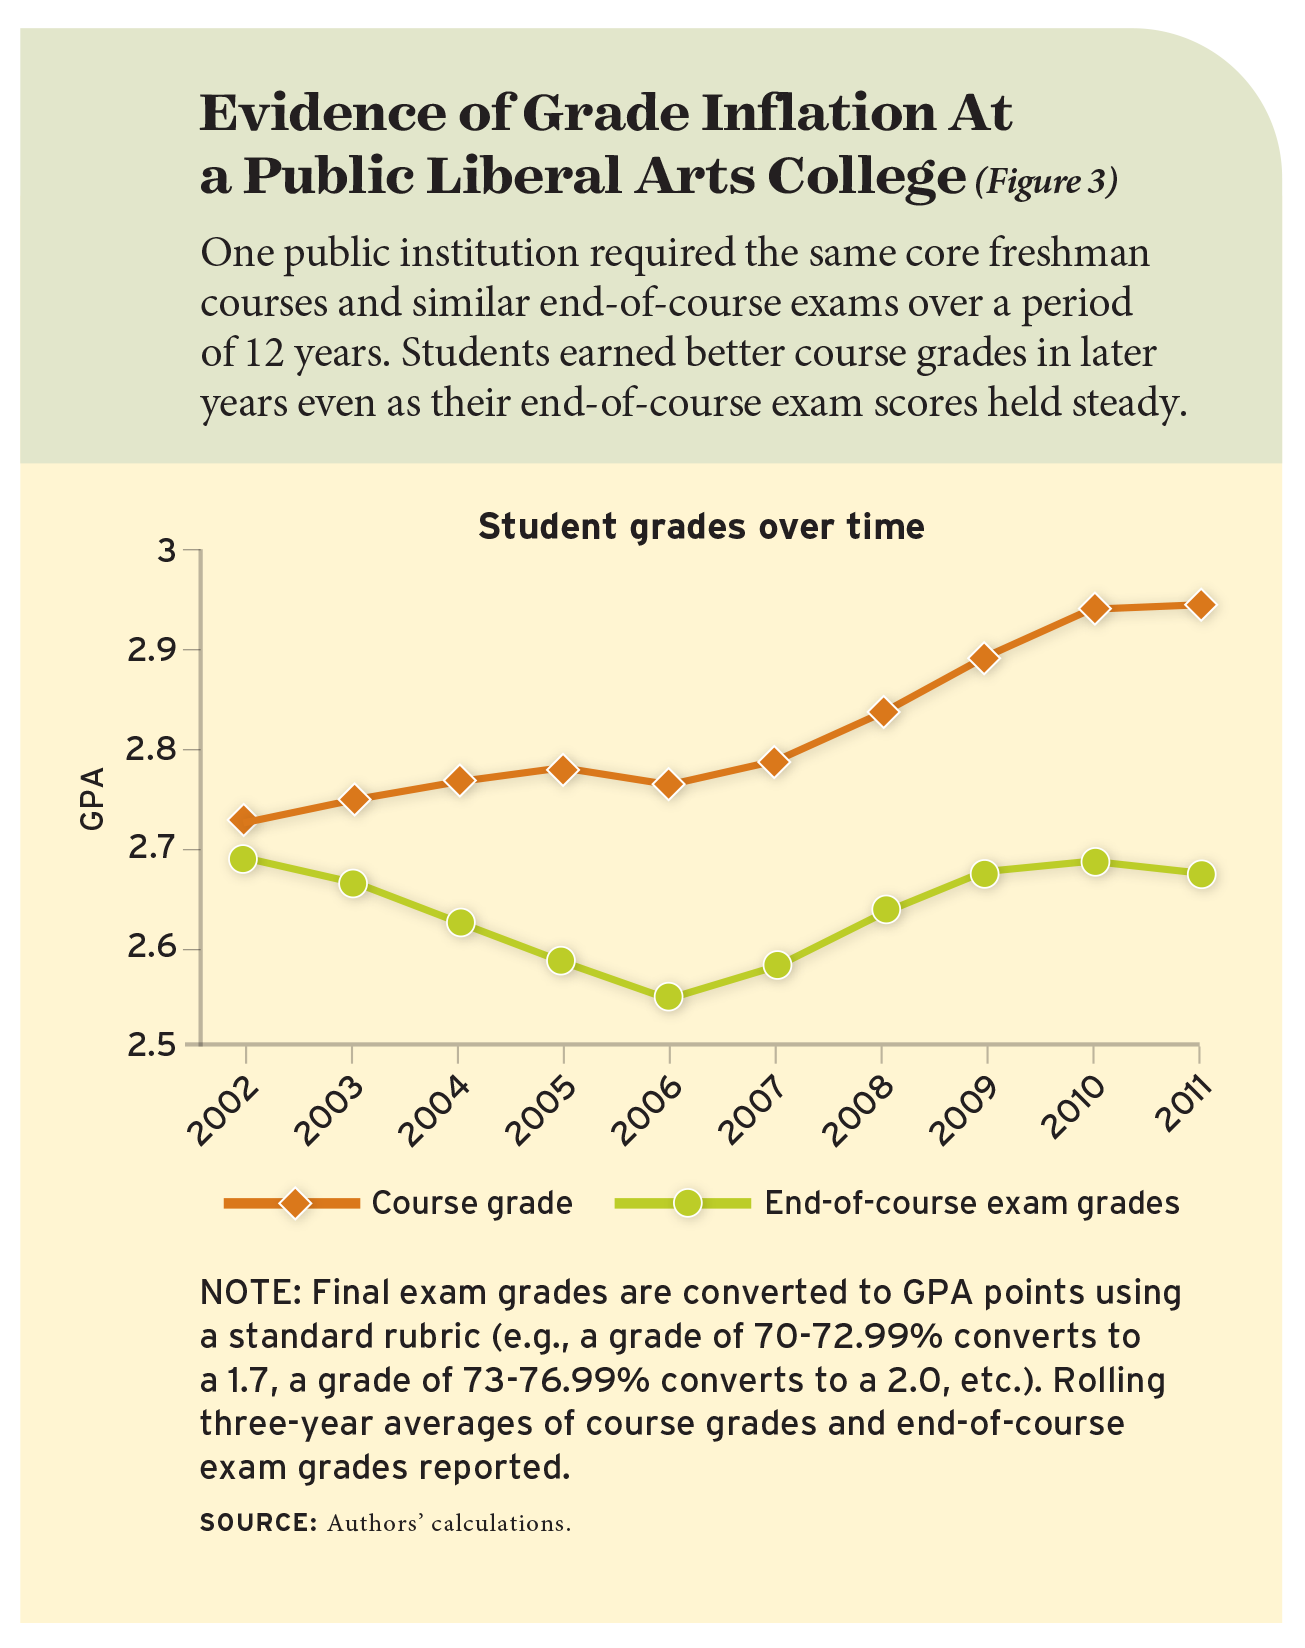
To investigate the possibility of college grade inflation, we find an ideal test at a public liberal arts college that required the same core courses and nearly identical end-of-course exams over a period of 12 years. In looking at student grades, exam scores, and graduate rates from 2001 to 2012, we find evidence of more lax standards in grading. In looking at the end-of-course exams, we see that in those classes, students earned better grades in later years even as their exam scores held steady. In two required science courses that gave the same tests over time, even as students’ grades were going up, their performance on nearly identical exams stayed about the same. Meanwhile, the school’s graduation rate grew to 85.9 percent from 83.1 percent during that time, and students’ grade-point averages increased to 3.02 from 2.77.
While earning a degree is something to be lauded, evidence of grade inflation raises important questions about the meaning of some college degrees. And with growing uncertainty about the relative return on investment in terms of both time and tuition, both students and institutions should take a hard look at the ultimate value of their efforts.
Gains in Graduation
We first establish that college graduation rates have increased since 1990 based on three sources of nationwide data. First, U.S. Census data show growth in the share of 25-year-olds who have earned bachelor’s degrees out of all 25-year-olds with at least some college education, to 46 percent in 2010 from 39 percent in 1990. This increase is especially large for women, to 49 percent in 2010 from 39 percent in 1990.
Second, we calculate changes in the rates of college graduation within eight years of students’ expected high-school graduation date based on two datasets from the National Center for Education Statistics: the National Education Longitudinal Study of 1988, which followed a representative sample of students who were in 8th grade in 1988 through high school, college, and early adulthood, and the Education Longitudinal Study of 2002, which did the same for a representative sample of students who were in 10th grade in 2002. Both studies collect detailed data about student and family backgrounds, academic performance in high school, and postsecondary education. They cease data collection eight years after the expected date of high-school graduation.
These federal data show that the share of college entrants graduating from any U.S. institution within eight years of high-school graduation increased by 3.8 percentage points between the 1988 and 2002 study sample groups, to 52.5 percent from 48.7 percent (see Figure 1). Among students attending the 50 top-ranked four-year public schools, identified based on 2005 rankings by U.S. News and World Report, the eight-year graduation rate increased to 90.7 percent of students from the 2002 group compared to 82.1 percent of the 1988 group. Among students attending public four-year schools not in the top 50, the eight-year graduation rate was 61 percent for the 2002 group compared to 56.1 percent for the 1988 group.
Third, we also look at the federal Integrated Post-secondary Education Data System, which shows six-year graduation rates for first-time, full-time students that match the trends in our other data sources. We consider data from 1990 to 2010 and look at graduation rates by institution type, including public (top 50 and non-top 50), nonprofit (highly selective and non-selective), and for-profit schools. The highest rates are for institutions with more competitive admissions standards: highly selective nonprofit universities and top-50 public schools. The lowest rate is for for-profit institutions, which experienced rapid growth in enrollment and declines in graduation rates. By contrast, the overall rates for all public and nonprofit institutions continuously increase from 1991 to 2010, with a combined, enrollment-weighted rate of 59.7 percent in 2010 compared to 52.0 percent in 1990.
What’s Driving Graduation Growth?
What accounts for this growth? Did students change, or was something on campus different?
Perhaps changes in enrollment are driving rates up. But in looking at our main samples, we see that college enrollment increased to 78.3 percent of the 2002 group from 69.3 percent of the 1988 group. Federal enrollment data from the Digest of Education Statistics show that enrollment has grown steadily since 1975 and that, at least since the 1990s, it has increased at every type of institution. With a larger fraction of students entering college, more students likely come from farther down the distribution of student achievement. Therefore, enrollment trends are unlikely to explain increases in graduation rates.
Perhaps students are, on the whole, more prepared for college than in the past. But performance of 17-year-old students in the United States on the math and reading portions of National Assessment of Educational Progress has been essentially unchanged since the 1970s. Using this information, we can make a measure of math test scores that are comparable over time. In the longitudinal surveys, we find that students from the 2002 group who earned college degrees within eight years had worse math performance in high school compared to their counterparts from the 1988 study. The average math test score percentile of college enrollees fell to 55.9 from 58.9. In these samples, student preparedness would predict a decline in graduation rates of 1.26 percentage points—not an increase.
Perhaps students are working harder at school. But prior research doesn’t show that. A study by Philip S. Babcock and Mindy Marks found that, while full-time college students spent 40 hours a week on their studies in the 1960s, they spent just 27 hours a week on schoolwork by 2003. Other research has found students are spending more time on paid labor while in college. For example, a study by Judith Scott-Clayton found that the average labor supply among full-time college students ages 18 to 22 grew to 11 hours per week in 2000 compared to 6 hours in 1970.
We investigate other potential factors, such as changes in the types of institutions students attend, college affordability, and instructional and other campus resources, as potential contributors to graduation-rate patterns. Enrollment growth was concentrated at non-elite institutions, even as inflation-adjusted tuition and fees increased by more than 300 percent since 1987. Meanwhile, the student-to-faculty ratios at colleges attended by the students in the 2002 and 1988 surveys were nearly the same, at 40.4 for the 2002 group compared to 39.4 for the 1988 group, while mean instructional expenditures per student fell somewhat to $4,288 from $4,581.
These trends would all predict decreases in graduation rates, not growth. In fact, in our analysis of the impact on student and institutional factors influencing likelihood of graduation, we find that students from the 2002 group are predicted to be 1.92 percentage points less likely to graduate than students from the 1988 group. But those students, in reality, graduated in greater numbers—they were 3.8 percentage points more likely to graduate than the 1988 group and 5.7 percentage points more likely to graduate than the predictive factors in our analysis would suggest.
We turn our attention to one trend that is associated with higher rates of degree attainment that is not yet accounted for in this analysis. The longitudinal surveys also tracked students’ grades once they were enrolled in college, and they show that students from the later sample earned better grades than their older forebearers. In the 2002 group, students had an average first-year college GPA of 2.65, while in the 1988 group, students had an average first-year college GPA of 2.44. What changed?
Investigating Grade Inflation
To explain the role of rising GPAs in increasing graduation rates, we incorporate two additional data sets into our review. We then explore the extent to which college GPA predicts graduation, how much GPAs have increased over the time frame considered, and whether that growth is well explained by observable student characteristics, course-taking behavior, or performance on end-of-course exams that have a constant level of difficulty over time.
Data: We look at four data sources. In addition to the longitudinal surveys from 1988 and 2002, we consider data from a group of nine large public universities for students who first enrolled between 1990 and 2000, as well as detailed student data from a public liberal arts college whose unique course requirements enable us to test our theory of grade inflation.
First, we look at student data from a group of nine large public universities from the Multiple-Institution Database for Investigating Engineering Longitudinal Development, known as the MIDFIELD database. This includes detailed information about 530,036 degree-seeking undergraduate students who started school between 1990 and 2000 at nine institutions: Clemson, the University of Colorado, Colorado State, the University of Florida, Florida State, Georgia Tech, North Carolina State, Purdue, and Virginia Tech. These data include demographics, SAT scores, individual course grades, and degrees earned, and the sample is similar to those in the longitudinal surveys in terms of math quartile, race, and gender. First-year GPA for students at these schools increases to 2.79 from 2.68 over the decade.
The other data set is from a public liberal arts college, which we do not identify. This college has required students take a set of core classes that include final exams that do not differ substantially over time. We review detailed data for the 14,193 students who entered the institution between 2001 and 2012, including demographics, graduation rates, individual course grades, and student scores on the final exam. While these students are unique in some ways, they have a similar distribution of race and ethnicity as those in the other samples, and we see similar trends in GPAs and graduation rates over time. Students’ GPAs increase to 3.02 in 2012 from 2.77 in 2001, and graduation rates grow to 85.9 percent from 83.1 percent.
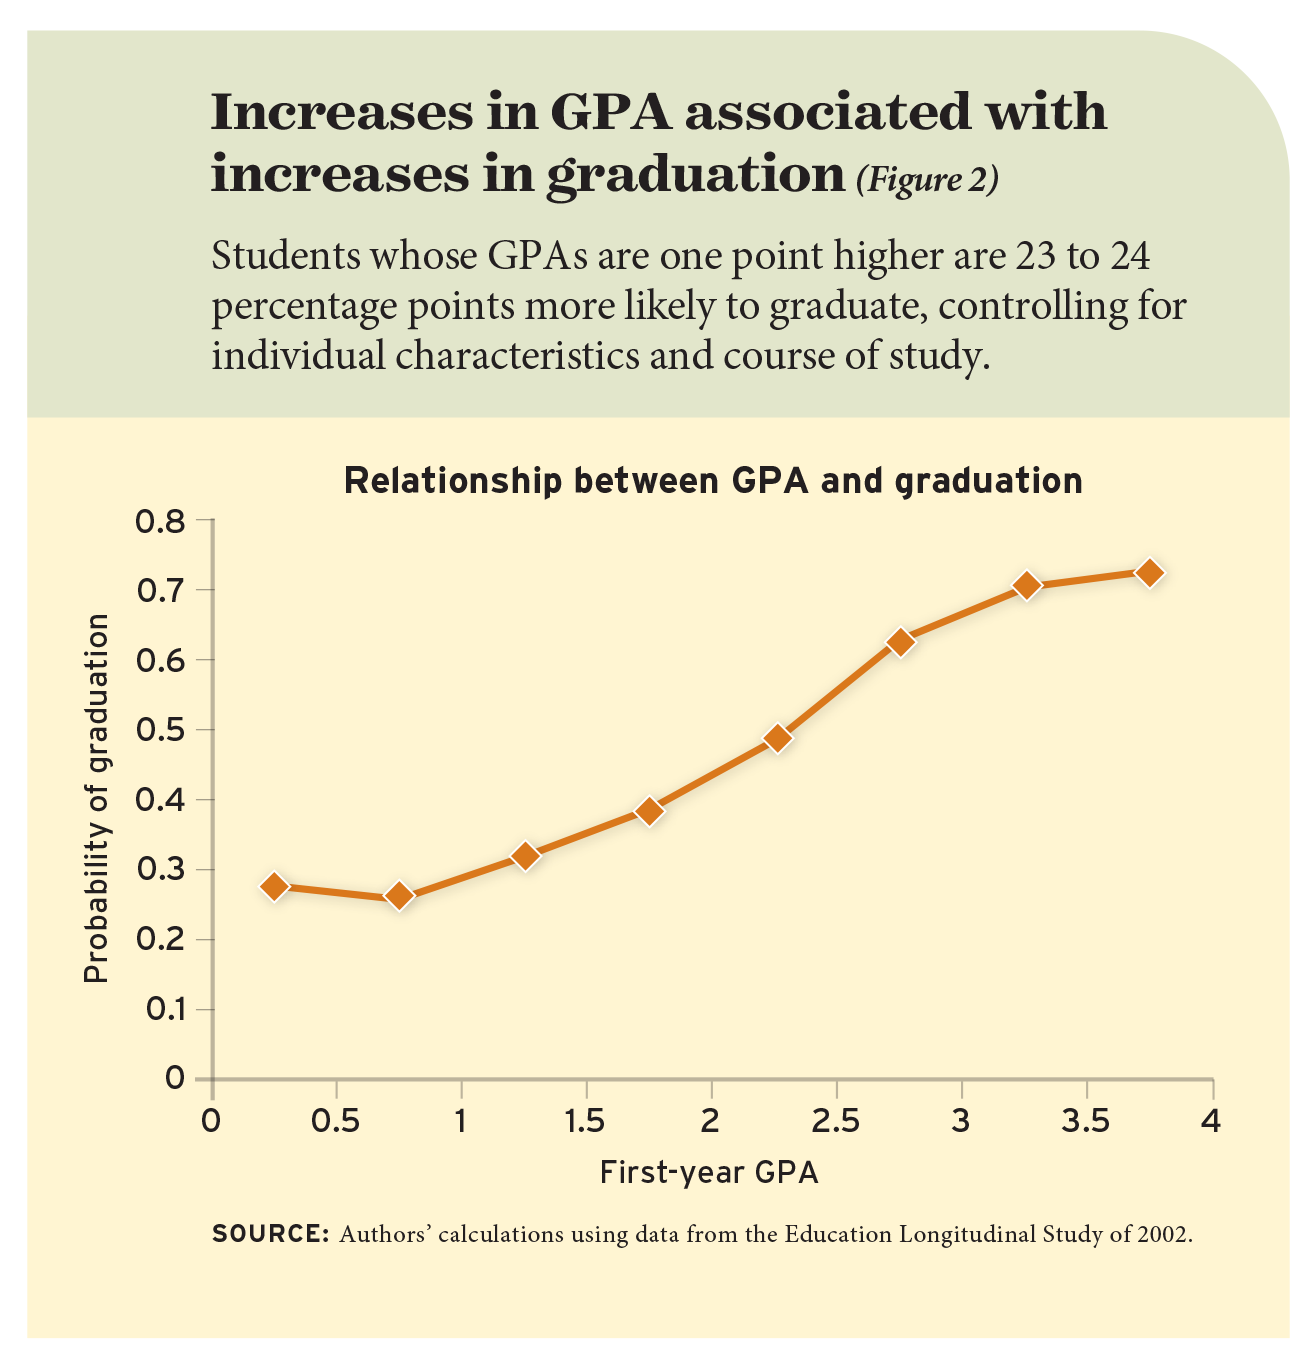
Trends in GPAs and graduation: We look at all four datasets and see that first-year college grades are always predictive of graduation. In both the 1988 and 2002 nationwide samples, a one-point increase in GPA is associated with an increase of about 22 to 24 percentage points in a student’s probability of graduation when controlling for student characteristics and the graduation rate of a student’s selected major (see Figure 2). In looking at the two additional datasets—the group of large public universities and the public liberals arts college—we find an increase of one point in a student’s GPA is associated with an increase of 16 to 21 percentage points in the likelihood of graduation.
We then look at the relationship between GPA and rates of graduation along the grade distribution spectrum and find the biggest differences are between students with D averages and those with C averages. This is likely for two reasons. First, students generally must maintain a GPA above a certain threshold to avoid dismissal. Second, GPA can act as a signal about a student’s ability to succeed in school. In either case, students with higher GPAs are more likely to graduate.
The data show that GPAs increased at all school types. In looking at the 1988 and 2002 samples, we see that 11 percent more first-year college students have a GPA above a 2.0 in the 2002 sample compared to the 1988 sample. This is notable because rules at many institutions require students to maintain GPAs of at least 2.0 in order to remain in good standing. We then look for differences between these samples in student characteristics, to see whether they change over time in ways that would predict increases in average GPA. This includes math scores, race, gender, and parents’ level of education and income—none of which change the effect of GPA substantively.
At the group of nine public universities, during the period we study we see that entering one year later is associated with an increase of 0.019 in first-year GPA. We also look for differences in student characteristics that could predict these increases, using a more detailed set of data that includes demographics as well as students’ SAT scores, home zip codes, transfer status, U.S. citizenship, and courses taken. We control for these factors and find that they explain only about a quarter of the estimated increase. Even the set of courses students choose to take in their first semester on campus does not explain the changes in first-year GPA.
A Real-World Test
The ideal test for whether rising grades can be explained by student preparation, effort, or learning would be a comprehensive assessment that had a constant level of difficulty that was given to students over a period of several years to measure learning in multiple courses. Then, we could see if the grades of students who scored the same on the assessment were increasing, decreasing, or staying the same over time.
We can, in fact, test our hypothesis thanks to a unique aspect of the educational program offered at the public liberal arts college we include in this review. The college requires students to take a number of standard courses that include end-of-course exams, which are either identical over time or have maintained a steady degree
of difficulty.
First, we look at students’ year of entry and average first-year course grades. We find that starting school a year later corresponds to a statistically significant increase of 0.025 grade points, and that this difference holds steady even when we control for students’ scores on end-of-course exams, the specific courses they take, and student characteristics including SAT test scores. This is true even when we consider only core courses required of all freshman students, suggesting that broad changes in the courses students take, characteristics of students, and overall learning as measured by final-exam performance are unlikely to explain improving GPAs over time.
However, it’s possible that the tests themselves have changed, so we look for courses where the exams have remained identical over time. We find two required freshman science classes where the final exams are comprehensive and are graded by machine or in teams. We then examined every version of that test, question by question, from 2001 to 2012 and found that 9 out of 12 were identical to an exam given in another year. This allows for a very close approximation of the ideal test for grade inflation. In looking at results on those tests, controlling for demographics and exam and course fixed effects, we find that entering school one year later corresponds to a large and statistically significant increase of 0.053 grade points (see Figure 3).
In other words, students with the exact same score on the exact same final exam earned better grades in later years. Given the close relationship between GPA and graduation, our finding that grades are increasing over time, even when student characteristics and performance on identical comprehensive final exams are accounted for, suggests that it’s getting easier to earn a degree at the public liberal arts college we study. And, given the similar trends we see between this one school and the nationwide samples from 1988 and 2002, we believe that this discovery is likely informative of broader trends.
How High Is Too High?
Our analysis finds that graduation rates among college students have increased since 1990 and that students are also earning higher grades. The increase in grade-point averages can explain much of the increase in graduation rates. And, in looking at reasons why students are earning higher grades, we present evidence that this increase is not explained by observable student or institution characteristics. Combined with existing work on trends in student study, college preparation, labor supply, the price of college, and resources per student, our evidence suggests that grade inflation is contributing to increasing grades and graduation rates.
Why did grade point averages increase from the 1990s to 2010? It is hard to know for sure. Instructors, departments, and institutions may have incentives to inflate grades or increase GPAs for reasons other than student performance. Instructors who give students higher grades receive better teaching evaluations and high-grading departments typically tend to have larger enrollments—one study found that when average grades were capped at B+ in high-grading departments at Wellesley College, for example, enrollments and professors’ ratings declined.
The recent policy focus on college completion rates seems a likely contributor to increases in average GPAs. As schools and departments face increased scrutiny and, in some cases, increased funding incentives, they may respond by increasing graduation rates. Changing standards of degree receipt is a low-cost way to increase graduation rates. And in fact, graduation rates increased sharply at public four-year schools and community colleges, which rely on tax dollars and can be affected by states’ performance-based funding rules.
Our findings may have important implications for efforts to calculate the returns on investment for a college degree. If institutions are lowering their standards for awarding a degree, as indicated by rising college grades, this could lead to a decline in the college wage premium. As with many policy levers, grade inflation has costs and benefits. We show that it led to an increase in college graduation rates. However, there may be deleterious effects of grade inflation if it changes what is learned in college. Our work highlights the importance of thinking of grading policy as a key decision that colleges make.
.
.
Jeffrey T. Denning is associate professor at Brigham Young University, where Eric R. Eide is professor and Richard W. Patterson is assistant professor. Kevin J. Mumford is associate professor and Kozuch director of the Purdue University Research Center in Education. Merrill Warnick is a graduate student at Stanford University.