Indeed, Latino groups’ voting preferences may be better understood by looking at religious affiliation and region, not ethnicity.
by and
Nearly 1 in 5 people in the United States today are Latino, and “the Latino vote” has attracted significant news coverage as their political voice grows stronger. Yet considering all 62 million Latinos as a group isn’t necessarily all that helpful in understanding attitudes or voting patterns, as some scholars and journalists have pointed out.
The U.S. Latino population is extremely diverse. As scholars who study immigration in the fields of sociology and religious ethics, we are especially interested in the growing religious diversity and often overlooked geographical diversity among Latino populations.
These aspects of Latino identity are just beginning to be recognized more clearly in media reports. Yet they are as informative as gender, race and other characteristics for understanding Latino voters – and will likely come into play when Americans go to the polls in November.
Religious diversity
Historically, Latinos in the U.S. have mostly been Catholic, but the numbers have recently changed. In 2020, the Public Religion Research Institute reported that 50% of Latinos say they are Catholic, 14% are evangelical Protestant, 10% non-evangelical Protestant and 19% religiously unaffiliated. Some researchers have estimated that by 2030, fully half of U.S. Latinos will identify as Protestant.
This diversity has implications for political ideology and affiliation. Latino Protestants, particularly evangelicals, are generally more likely to identify as politically conservative and to support Republican candidates than Latino Catholics are, according to the Public Religion Research Institute’s 2020 Census of American Religion. Religiously unaffiliated Latinos, on the other hand, are generally more likely to identify as politically liberal and to support Democratic candidates.
These trends are similar to those among non-Latino white Americans. Political ideology by age also looks similar: Whether Latino or not, younger groups are more likely to identify as politically liberal, whereas older groups are more likely to identify as politically conservative.
Indeed, Latino groups’ voting preferences may be better understood by looking at religious affiliation, not ethnicity. Sociologist Gerardo Marti, for example, has shown that Latinos who identify as evangelical Protestants are more likely than other Latinos to embrace Christian nationalist ideas. This ideology promotes the view that the U.S. has a special relationship with God and that it should be governed by Christian principles. Marti also shows that evangelical Latinos are more likely to align with white evangelicals in favoring policies that maintain the political dominance of white Americans.
Protestant Latinos are also more likely than other Latinos to hold anti-immigrant sentiments, which track with attitudes among non-Latino white evangelicals. This may seem counterintuitive, since Latinos have been subject to racist stereotyping and often have connections to immigrant communities. However, immigrant groups’ attitudes toward newcomers do change over time, especially if those groups begin to gain access to privileges associated with whiteness.
Geographic diversity
The media has begun to pay more attention to Latino diversity, especially in the wake of the 2020 presidential election, but tends to focus on states like Florida, California and Texas. Regions where Latino communities are smaller but growing are understudied, particularly in the Midwest – home to five of the 13 battleground states in 2020.
Comparing by Census regions, the Latino population of the Midwest grew 28% between 2010 and 2020: the second-largest rate of all regions, only 2 percentage points less than in the South. The Midwest also has the youngest Latino population, with a median age of 26.7 years. Because there is a significant association between age and political opinion, and because younger Latinos are more likely to be U.S. citizens and therefore able to vote, this could become a factor in the future.
Taken together
The intersection of religious and political affiliation among Latinos in the United States also seems to vary by geography. Considering geography and religion together helps highlight diversity among Latino voters.
Based on our analysis of polling data from the Pew Research Center’s American Trends Panel Wave 86, Latino Protestants in the Midwest are more likely to identify as Democrat or Democrat-leaning than in other regions: about 74%, compared with approximately 63% in the Northeast and 52% in the West and South. Meanwhile, 86% of Latino Catholics in the Northeast identify with the Democratic Party – but only 66% in the South.
Among religiously unaffiliated Latinos, meanwhile, 65% in the Midwest identify with the Democrats, lower than in any other region. These differences are intriguing, but since Pew only surveyed 207 Latinos in this region, representing just 6.1% of the total sample, it is difficult to reach statistically well-grounded conclusions – another reason for more research in the Midwest.
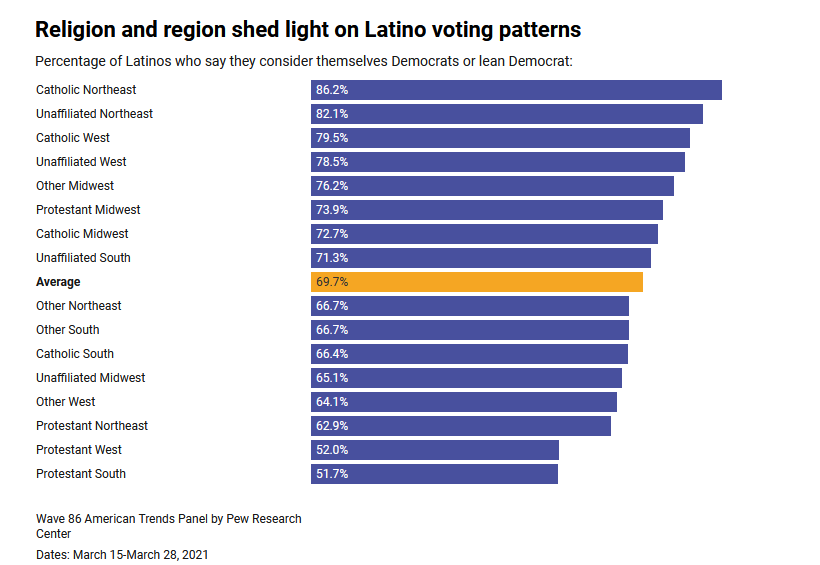
Chart: The Conversation, CC-BY-ND Source: Pew Research Center Get the data
The problem with understanding “the Latino vote” is that there really is no such thing. Latino communities have always been diverse, and are growing even more so.
.
Laura E. Alexander is an Associate Professor of Religious Studies, Goldstein Family Community Chair in Human Rights, University of Nebraska Omaha
Cristian Doña-Reveco is a Associate Professor, Department of Sociology and Anthropology; Director, Office of Latino/Latin American Studies, University of Nebraska Omaha