by The Peterson Foundation
Understanding the United States’ changing labor force can be a key part of understanding larger trends in the overall economy. The Bureau of Labor Statistics (BLS) publishes details annually on the demographics, labor force participation, occupations, and earnings of the foreign-born population of the United States. Along with information gathered each year by the American Community Survey (ACS), the BLS data provide an objective and useful look at the contributions that foreign-born individuals make to the United States’ economy. Outlined in this blog post are key characteristics of the foreign-born population and how they compare to the native-born population.
Highlights from the most recent BLS and ACS data include the following data for 2018:
- There were 28 million foreign-born workers in the United States, who made up 17 percent of the total workforce.
- Overall, foreign-born workers earn 83 percent as much as native-born workers; however, foreign-born workers that are age 25 or older with at least a bachelor’s degree earn more than native-born workers with those characteristics.
- The unemployment rate for the foreign-born population age 25 or older was about the same as for the native-born population.
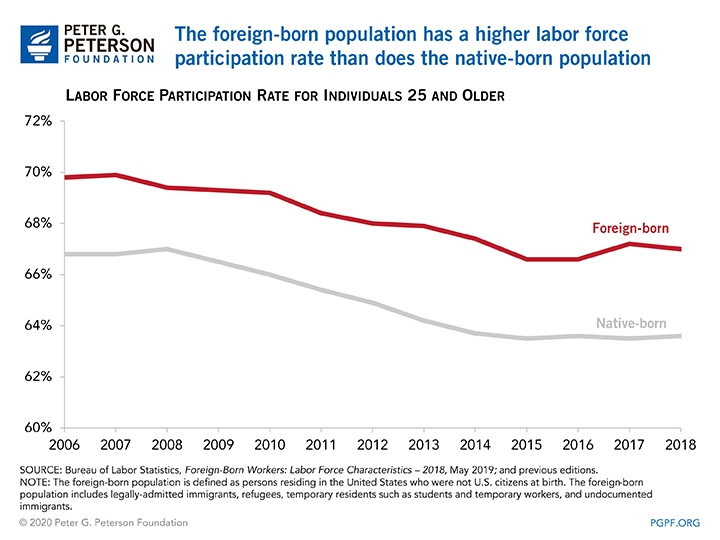
- The foreign-born population has a higher rate of labor force participation than the native-born population.
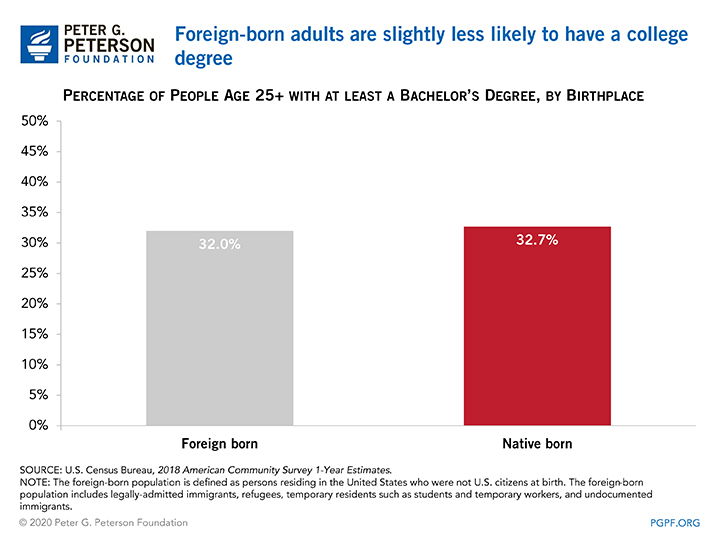
- The share of foreign-born adults with at least a bachelor’s degree is lower than the share of native-born adults with that level of education. However, foreign-born individuals from several specific regions of the world earn bachelor’s degrees at higher rates than the native-born population.
How Do We Define “Foreign-Born”?
According to BLS, the foreign-born population is defined as “persons residing in the United States who were not U.S. citizens at birth.” That includes “legally-admitted immigrants, refugees, temporary residents such as students and temporary workers, and undocumented immigrants.” Conversely, BLS defines the native-born population as “persons born in the United States or one of its outlying areas such as Puerto Rico or Guam or who were born abroad of at least one parent who was a U.S. citizen.”
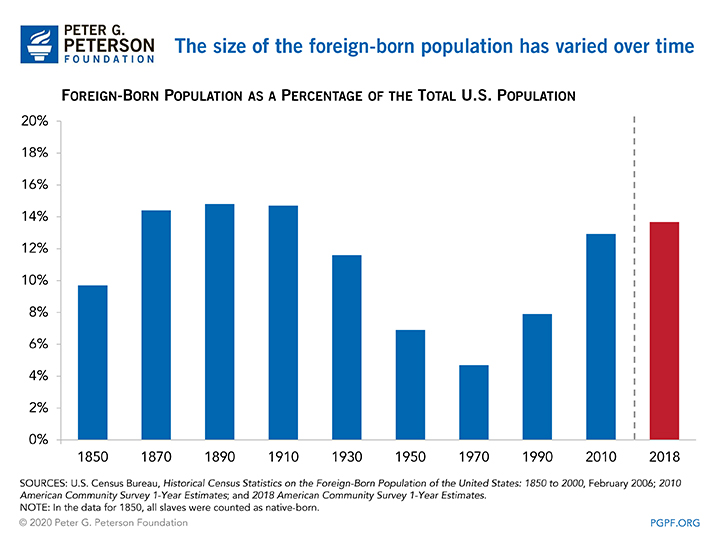
In 2018, the U.S. population of 327 million included 45 million foreign-born individuals, or roughly 14 percent. That percentage has varied throughout history. In 1970, for example, foreign-born individuals comprised only 5 percent of the total population. At other points in history, such as the late 1800s, the foreign-born population was about the same share of the population as it is today.
How Much Do Foreign – Born Workers Earn?
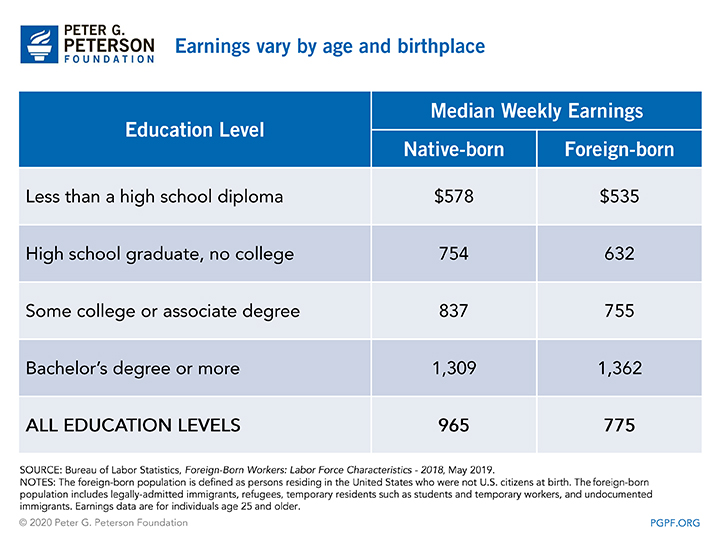
Foreign-born individuals typically earn less than native-born individuals — on average, 83 cents for every dollar earned by their native-born counterparts. That disparity generally holds true across age groups and education levels, with one significant exception. Foreign-born individuals with a bachelor’s degree or more had median weekly earnings of $1,362 per week in 2018, about $53 per week higher than the median for the native-born population with that level of education.
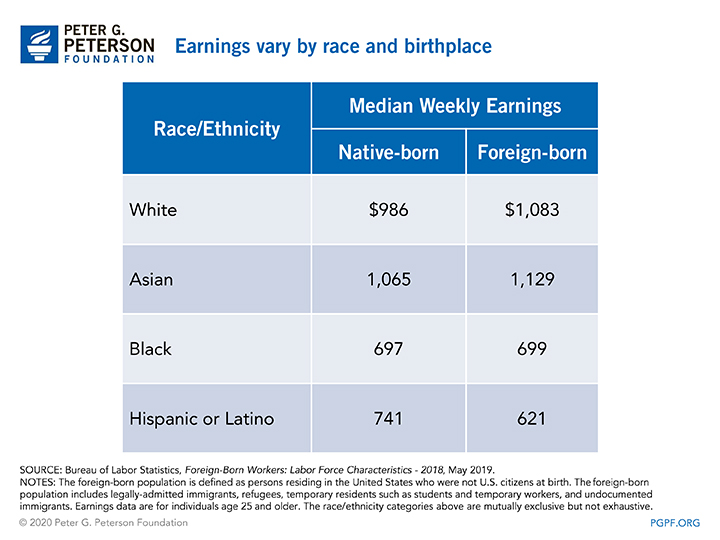
A different story emerges when analyzing the data by race. For White and Asian workers, foreign-born individuals earn slightly more than those who are native-born. For Black workers, the foreign-born and native-born earn about the same amount. And for workers who are Hispanic or Latino, the foreign-born earn considerably less (16 percent) than the native-born.
Employment Rates of Foreign-Born Workers
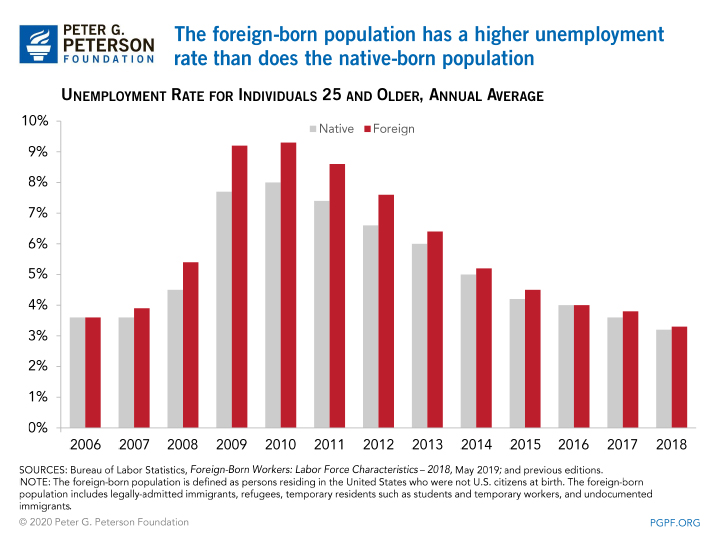
Since 2006, the unemployment rate for foreign-born individuals has tended to be slightly higher than the unemployment rate for native-born individuals. However, in the years since the Great Recession, that gap has fallen from a peak of 1.5 percentage points in 2009 to 0.1 percentage points in 2018. In that year, the foreign-born population age 25 and older had an average unemployment rate of 3.3 percent — slightly above the rate of 3.2 percent for the native-born population.
Meanwhile, the foreign-born population has a higher rate of labor force participation. According to BLS, 67 percent of the foreign-born population age 25 and older participated in the labor force in 2018, while the native-born rate is 63.6 percent. That difference of 3.4 percentage points means that a significantly larger share of the foreign-born population is either employed or unemployed and looking for work.
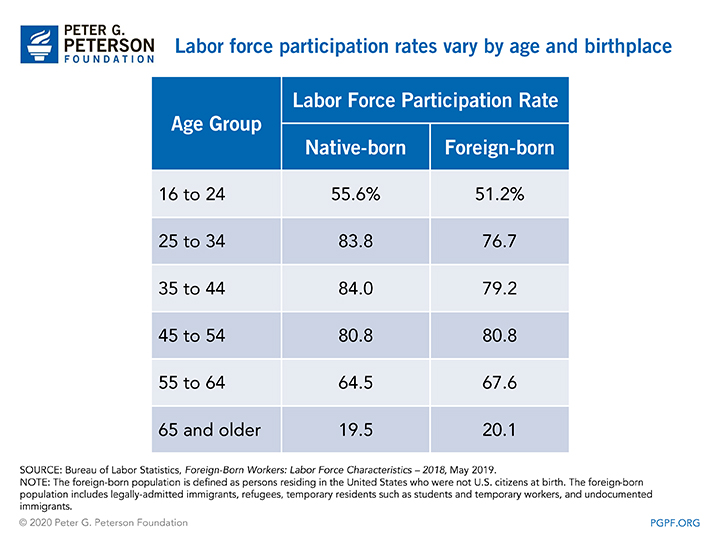
Although the foreign-born population has a higher overall labor force participation rate, that rate varies among age groups. For example, the native-born population age 25 to 34 had a labor force participation rate of 83.8 percent in 2018, which was 7.1 percentage points higher than the corresponding foreign-born population. However, for the 55 to 64 year old age group, foreign-born individuals participated in the labor force at a rate that was 3.1 percentage points higher.
Education Level of Foreign-Born Workers
The native-born population has a slightly higher level of educational attainment than does the foreign-born population. In 2018, 32.7 percent of the native-born population age 25 and older had a bachelor’s degree or more. For the foreign-born population age 25 and older, the percentage with a bachelor’s degree or more was 32.0 percent.
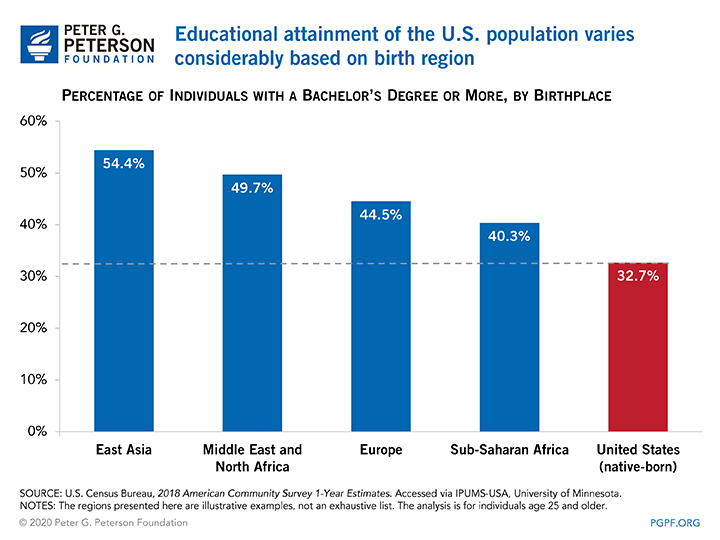
However, foreign-born individuals from several regions of the world have considerably higher levels of educational attainment than the foreign-born population as a whole. In fact, individuals born in four regions outrank the native-born population on that metric. Those who are now living in the United States but were born in East Asia, the Middle East and North Africa, Europe, and Sub-Saharan Africa are more likely to have bachelor’s degrees than the native-born population of the United States.
English Proficiency Among Foreign-born Individuals
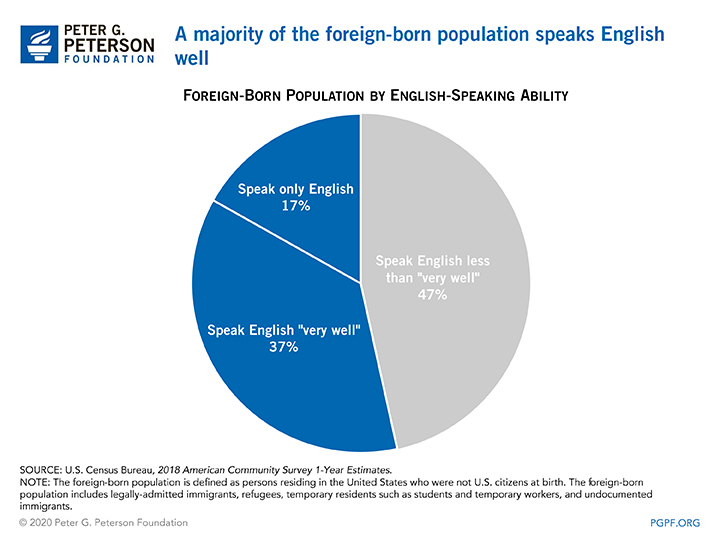
The ACS collects data each year about the English proficiency of individuals age 5 or older. Data from the survey showed that in 2018, 17 percent of the foreign-born population spoke only English at home. A further 37 percent spoke English “very well”. The remaining share of foreign-born individuals, nearly half of the total, characterize their skills in English as less proficient.
The U.S. labor force is changing in many ways. A substantial part of the labor force is foreign-born, so an understanding of that population’s characteristics is key to understanding the overall economy. The information provided by BLS and the ACS on the foreign-born workforce can help policymakers as they consider and pass legislation aimed at promoting a healthy economy.
.