Latinos have grown at the second-fastest rate of any major racial and ethnic group in the U.S. electorate since the last presidential election. An estimated 36.2 million are eligible to vote this year, up from 32.3 million in 2020. This represents 50% of the total growth in eligible voters during this time.
Every year, about 1.4 million Hispanics in the U.S. become eligible to vote.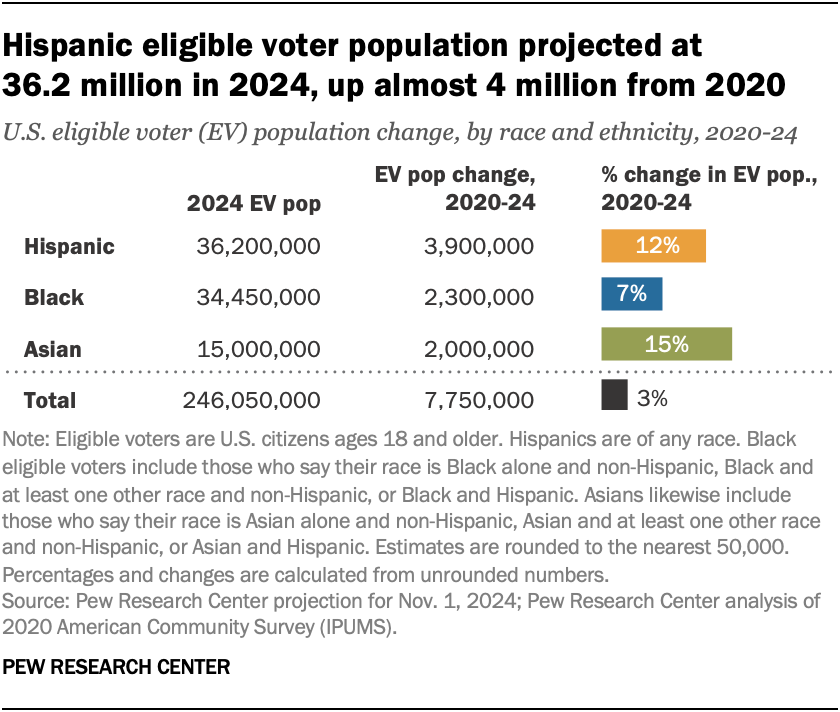
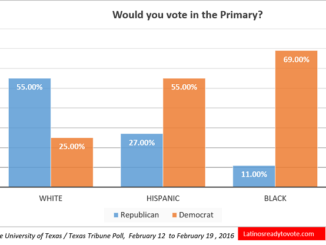
Although then-President Donald Trump made gains among Hispanics in 2020, a majority of Latino voters (59%) voted for current President Joe Biden that year, according to a Pew Research Center analysis of validated voters. In presidential elections, turnout rates among Hispanic Americans have typically trailed those of some other groups.
As the next presidential election approaches, here are five key facts about Hispanic eligible voters in the United States, based on our own projections for 2024, as well as Census Bureau data for previous years. (Eligible voters in this analysis are defined as citizens ages 18 and older residing in the 50 states and the District of Columbia. Not all eligible voters are actually registered to vote. Detailed demographic information about Hispanic eligible voters is available in the drop-down box at the bottom of this post.)
1. Latinos are projected to account for 14.7% of all eligible voters in November 2024, a new high. This share has steadily increased over the past two decades and is up from 13.6% in 2020. In 2000, by comparison, Hispanics made up just 7.4% of U.S. eligible voters.
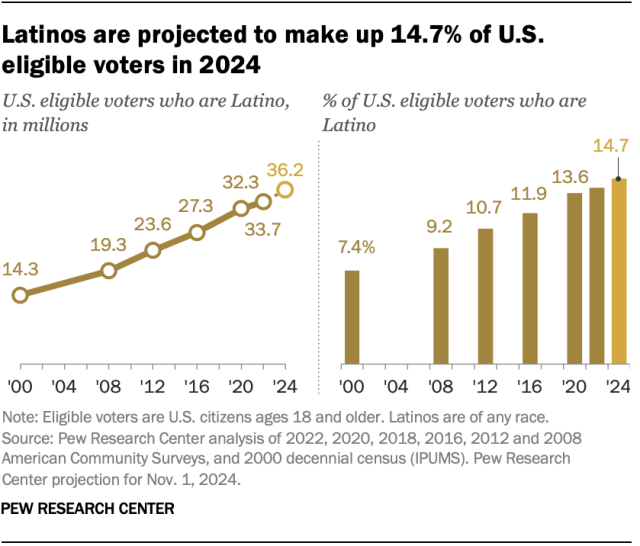
The number of Hispanic eligible voters has increased from 32.3 million in 2020 to a projected 36.2 million in November 2024. This in turn is a 153% increase since 2000, when 14.3 million Hispanics were eligible.
2. California is home to a quarter of all Hispanic eligible voters. Some 8.5 million out of the nation’s 33.7 million Hispanic eligible voters, or 25%, lived in California as of 2022. The next biggest states by number of Latino eligible voters are Texas (6.5 million), Florida (3.5 million), New York (2.2 million) and Arizona (1.3 million).
Together, these five states hold about two-thirds (65%) of all Hispanic eligible voters.
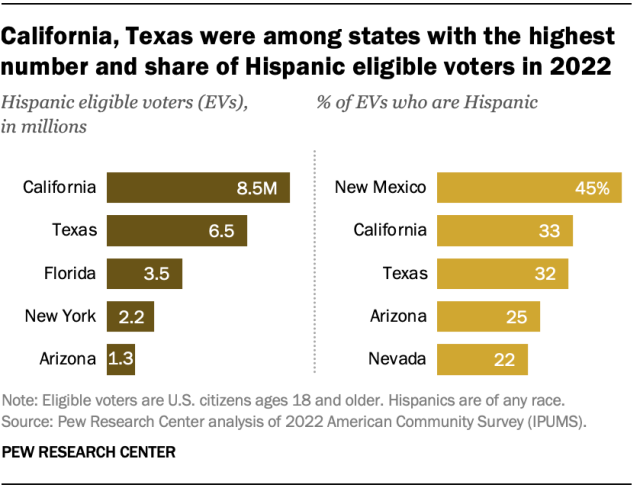
3. In New Mexico, 45% of all eligible voters are Latino, the highest share of any state. New Mexico is also the only state in which Latinos make up a higher share of the total eligible voter population than any other racial or ethnic group. This includes Americans who are White alone and non-Hispanic, who account for 40% of New Mexico’s eligible voters.
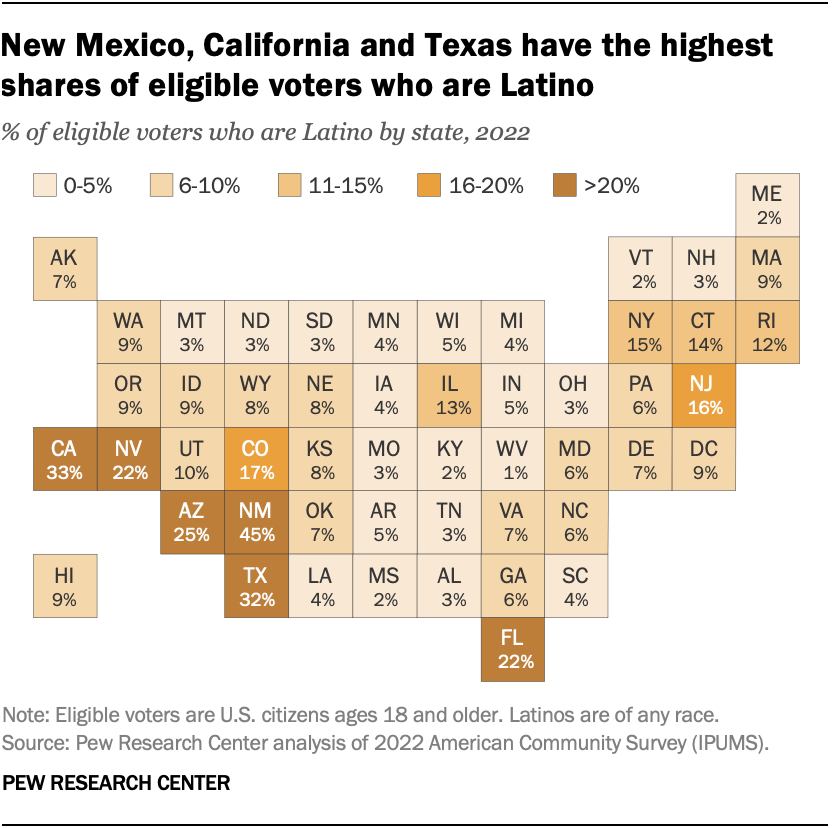
In California and Texas, Hispanics are about a third of the eligible voter population (33% and 32%, respectively).
California and Texas are also the only states where non-Hispanics who are White and no other race make up a plurality, but not a majority, of the eligible voter population (42% in California and 47% in Texas). In both states, Hispanics hold the second-highest share among major racial and ethnic groups.
The states with the next-largest Latino shares of eligible voters are Arizona (25%), Nevada (22%), Florida (22%), Colorado (17%) and New Jersey (16%).
4. A narrow majority of Latinos in the U.S. are eligible to vote. A little over half of all Latinos (53%) were eligible to vote in 2022.
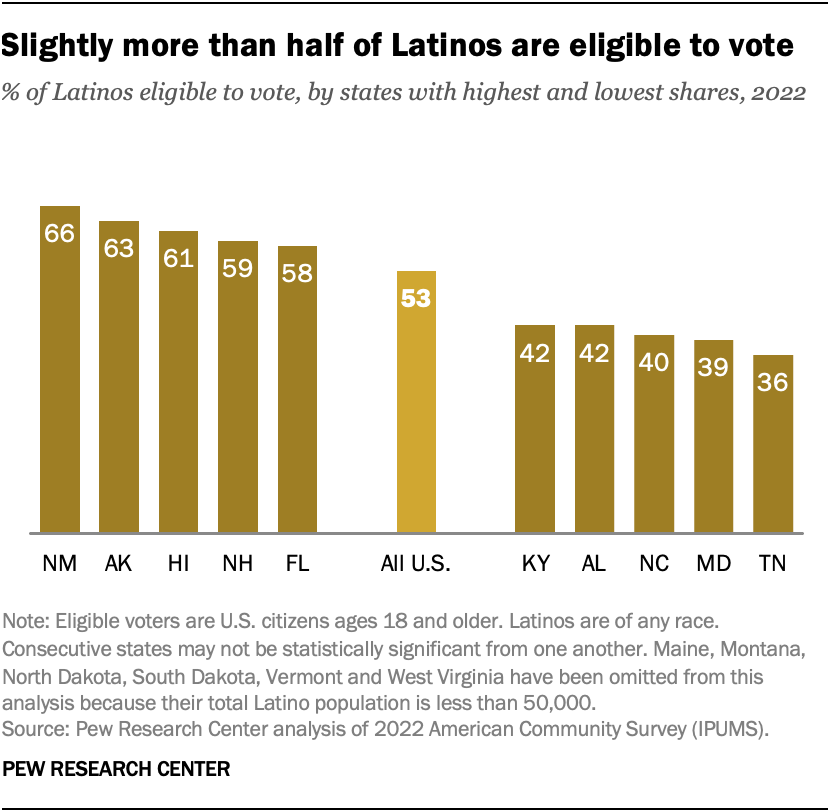
But the share varies widely by states with a Latino population of 50,000 or more. In New Mexico, 66% of Hispanics are eligible to vote. By contrast, Tennessee (36%) and Maryland (39%) had the lowest percentage of Latinos among eligible voters.
Latinos are considerably less likely than Americans overall to be eligible to vote (53% vs. 72%). This is partly because the nation’s Latino population includes a large number of people who are too young to vote or who are not U.S. citizens:
- 29% of Latinos are under 18, compared with 22% of the U.S. overall.
- 19% of Latinos are not U.S. citizens, compared with 6% of the total U.S. population.
Latino immigrants who are not eligible to vote include permanent residents (green card holders) and those in the process of becoming permanent residents; those in the U.S. on temporary visas; and unauthorized immigrants.
5. Hispanic eligible voters tend to be younger than eligible voters overall. Only 33% of Latino eligible voters are ages 50 and older, compared with 48% of all U.S. eligible voters.
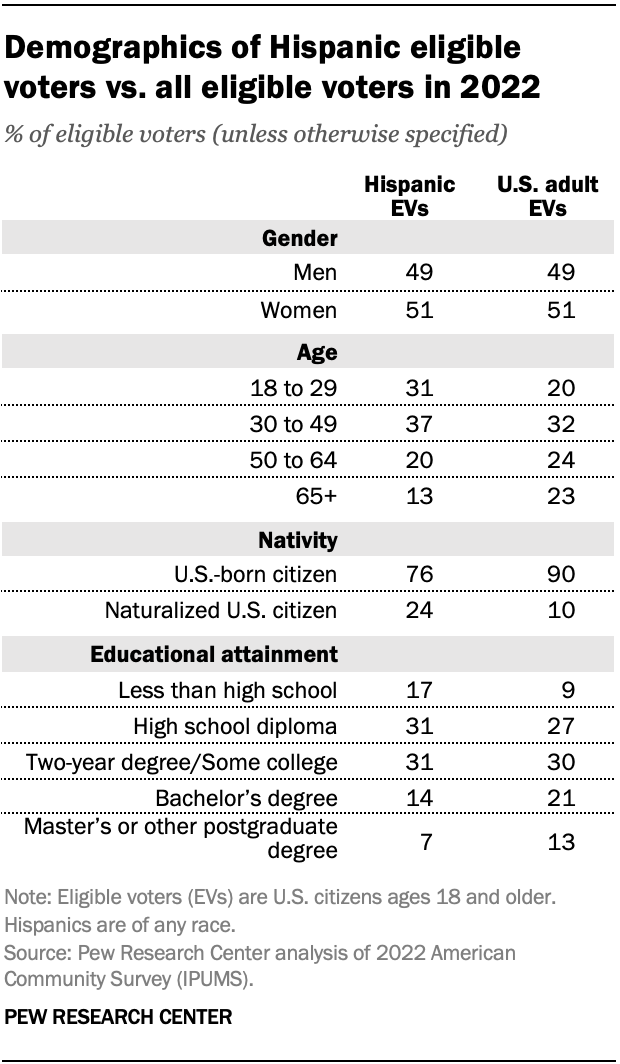
Latino eligible voters differ from the broader electorate in other ways, too. For example, 21% of Hispanic eligible voters have a bachelor’s degree or more education, compared with 33% of U.S. eligible voters overall.
.
Detailed data on Hispanic eligible voters by state in 2022 by Latinos Ready To Vote on
.